View allAll Photos Tagged monitoring
The Komodo dragon (Varanus komodoensis), also known as the Komodo monitor, is a large species of lizard found in the Indonesian islands of Komodo, Rinca, Flores, Gili Motang, and Padar. A member of the monitor lizard family Varanidae, it is the largest living species of lizard, growing to a maximum length of 3 metres in rare cases and weighing up to approximately 70 kilograms.
Their unusually large size has been attributed to island gigantism, since no other carnivorous animals fill the niche on the islands where they live. However, recent research suggests the large size of Komodo dragons may be better understood as representative of a relict population of very large varanid lizards that once lived across Indonesia and Australia, most of which, along with other megafauna, died out after the Pleistocene. Fossils very similar to V. komodoensis have been found in Australia dating to greater than 3.8 million years ago, and its body size remained stable on Flores, one of the handful of Indonesian islands where it is currently found, over the last 900,000 years, "a time marked by major faunal turnovers, extinction of the island's megafauna, and the arrival of early hominids by 880 ka [kiloannums]."
As a result of their size, these lizards dominate the ecosystems in which they live. Komodo dragons hunt and ambush prey including invertebrates, birds, and mammals. It has been claimed that they have a venomous bite; there are two glands in the lower jaw which secrete several toxic proteins. The biological significance of these proteins is disputed, but the glands have been shown to secrete an anticoagulant. Komodo dragon group behaviour in hunting is exceptional in the reptile world. The diet of big Komodo dragons mainly consists of deer, though they also eat considerable amounts of carrion. Komodo dragons also occasionally attack humans in the area of West Manggarai Regency where they live in Indonesia.
Mating begins between May and August, and the eggs are laid in September. About 20 eggs are deposited in abandoned megapode nests or in a self-dug nesting hole. The eggs are incubated for seven to eight months, hatching in April, when insects are most plentiful. Young Komodo dragons are vulnerable and therefore dwell in trees, safe from predators and cannibalistic adults. They take 8 to 9 years to mature, and are estimated to live up to 30 years.
Komodo dragons were first recorded by Western scientists in 1910. Their large size and fearsome reputation make them popular zoo exhibits. In the wild, their range has contracted due to human activities, and they are listed as vulnerable by the IUCN. They are protected under Indonesian law, and a national park, Komodo National Park, was founded to aid protection efforts.
ETYMOLOGY
The Komodo dragon is also known as the Komodo monitor or the Komodo Island monitor in scientific literature, although this is not very common. To the natives of Komodo Island, it is referred to as ora, buaya darat (land crocodile), or biawak raksasa (giant monitor).
EVOLUTIONARY HISTORY
The evolutionary development of the Komodo dragon started with the Varanus genus, which originated in Asia about 40 million years ago and migrated to Australia. Around 15 million years ago, a collision between Australia and Southeast Asia allowed the varanids to move into what is now the Indonesian archipelago, extending their range as far east as the island of Timor. The Komodo dragon was believed to have differentiated from its Australian ancestors 4 million years ago. However, recent fossil evidence from Queensland suggests the Komodo dragon evolved in Australia before spreading to Indonesia. Dramatic lowering of sea level during the last glacial period uncovered extensive stretches of continental shelf that the Komodo dragon colonized, becoming isolated in their present island range as sea levels rose afterwards.
DESCRIPTION
In the wild, an adult Komodo dragon usually weighs around 70 kg, although captive specimens often weigh more. According to the Guinness Book of World Records, an average adult male will weigh 79 to 91 kg and measure 2.59 m, while an average female will weigh 68 to 73 kg and measure 2.29 m. The largest verified wild specimen was 3.13 m long and weighed 166 kg, including undigested food. The Komodo dragon has a tail as long as its body, as well as about 60 frequently replaced, serrated teeth that can measure up to 2.5 cm in length. Its saliva is frequently blood-tinged, because its teeth are almost completely covered by gingival tissue that is naturally lacerated during feeding. This creates an ideal culture for the bacteria that live in its mouth. It also has a long, yellow, deeply forked tongue. Komodo dragon skin is reinforced by armoured scales, which contain tiny bones called osteoderms that function as a sort of natural chain-mail. This rugged hide makes Komodo dragon skin poorly suited for making into leather.
SENSES
As with other Varanids, Komodo dragons have only a single ear bone, the stapes, for transferring vibrations from the tympanic membrane to the cochlea. This arrangement means they are likely restricted to sounds in the 400 to 2,000 hertz range, compared to humans who hear between 20 and 20,000 hertz. It was formerly thought to be deaf when a study reported no agitation in wild Komodo dragons in response to whispers, raised voices, or shouts. This was disputed when London Zoological Garden employee Joan Proctor trained a captive specimen to come out to feed at the sound of her voice, even when she could not be seen.
The Komodo dragon can see objects as far away as 300 m, but because its retinas only contain cones, it is thought to have poor night vision. The Komodo dragon is able to see in color, but has poor visual discrimination of stationary objects.
The Komodo dragon uses its tongue to detect, taste, and smell stimuli, as with many other reptiles, with the vomeronasal sense using the Jacobson's organ, rather than using the nostrils. With the help of a favorable wind and its habit of swinging its head from side to side as it walks, a Komodo dragon may be able to detect carrion from 4–9.5 km away. It only has a few taste buds in the back of its throat. Its scales, some of which are reinforced with bone, have sensory plaques connected to nerves to facilitate its sense of touch. The scales around the ears, lips, chin, and soles of the feet may have three or more sensory plaques.
BEHAVIOUR AND ECOLOGY
The Komodo dragon prefers hot and dry places, and typically lives in dry, open grassland, savanna, and tropical forest at low elevations. As an ectotherm, it is most active in the day, although it exhibits some nocturnal activity. Komodo dragons are solitary, coming together only to breed and eat. They are capable of running rapidly in brief sprints up to 20 km/h, diving up to 4.5 m, and climbing trees proficiently when young through use of their strong claws. To catch out-of-reach prey, the Komodo dragon may stand on its hind legs and use its tail as a support. As it matures, its claws are used primarily as weapons, as its great size makes climbing impractical.
For shelter, the Komodo dragon digs holes that can measure from 1–3 m wide with its powerful forelimbs and claws. Because of its large size and habit of sleeping in these burrows, it is able to conserve body heat throughout the night and minimize its basking period the morning after. The Komodo dragon hunts in the afternoon, but stays in the shade during the hottest part of the day. These special resting places, usually located on ridges with cool sea breezes, are marked with droppings and are cleared of vegetation. They serve as strategic locations from which to ambush deer.
DIET
Komodo dragons are carnivores. Although they eat mostly carrion, they will also ambush live prey with a stealthy approach. When suitable prey arrives near a dragon's ambush site, it will suddenly charge at the animal and go for the underside or the throat. It is able to locate its prey using its keen sense of smell, which can locate a dead or dying animal from a range of up to 9.5 km. Komodo dragons have been observed knocking down large pigs and deer with their strong tails.
Komodo dragons eat by tearing large chunks of flesh and swallowing them whole while holding the carcass down with their forelegs. For smaller prey up to the size of a goat, their loosely articulated jaws, flexible skulls, and expandable stomachs allow them to swallow prey whole. The vegetable contents of the stomach and intestines are typically avoided. Copious amounts of red saliva the Komodo dragons produce help to lubricate the food, but swallowing is still a long process (15–20 minutes to swallow a goat). A Komodo dragon may attempt to speed up the process by ramming the carcass against a tree to force it down its throat, sometimes ramming so forcefully, the tree is knocked down. To prevent itself from suffocating while swallowing, it breathes using a small tube under the tongue that connects to the lungs. After eating up to 80% of its body weight in one meal, it drags itself to a sunny location to speed digestion, as the food could rot and poison the dragon if left undigested for too long. Because of their slow metabolism, large dragons can survive on as little as 12 meals a year. After digestion, the Komodo dragon regurgitates a mass of horns, hair, and teeth known as the gastric pellet, which is covered in malodorous mucus. After regurgitating the gastric pellet, it rubs its face in the dirt or on bushes to get rid of the mucus, suggesting, like humans, it does not relish the scent of its own excretions.
The largest animals eat first, while the smaller ones follow a hierarchy. The largest male asserts his dominance and the smaller males show their submission by use of body language and rumbling hisses. Dragons of equal size may resort to "wrestling". Losers usually retreat, though they have been known to be killed and eaten by victors.
The Komodo dragon's diet is wide-ranging, and includes invertebrates, other reptiles (including smaller Komodo dragons), birds, bird eggs, small mammals, monkeys, wild boar, goats, deer, horses, and water buffalo. Young Komodos will eat insects, eggs, geckos, and small mammals. Occasionally, they consume humans and human corpses, digging up bodies from shallow graves. This habit of raiding graves caused the villagers of Komodo to move their graves from sandy to clay ground and pile rocks on top of them to deter the lizards. The Komodo dragon may have evolved to feed on the extinct dwarf elephant Stegodon that once lived on Flores, according to evolutionary biologist Jared Diamond.
The Komodo dragon drinks by sucking water into its mouth via buccal pumping (a process also used for respiration), lifting its head, and letting the water run down its throat.
SALIVA
Auffenberg described the Komodo dragon as having septic pathogens in its saliva (he described the saliva as "reddish and copious"), specifically the bacteria E. coli, Staphylococcus sp., Providencia sp., Proteus morgani, and P. mirabilis. He noted, while these pathogens can be found in the mouths of wild Komodo dragons, they disappear from the mouths of captive animals, due to cleaner diets and the use of antibiotics. This was verified by taking mucous samples from the external gum surfaces of the upper jaws of two freshly captured individuals. Saliva samples were analyzed by researchers at the University of Texas, who found 57 strains of bacteria growing in the mouths of three wild Komodo dragons, including Pasteurella multocida. The rapid growth of these bacteria was noted by Fredeking: "Normally it takes about three days for a sample of P. multocida to cover a Petri dish; ours took eight hours. We were very taken aback by how virulent these strains were". This study supported the observation that wounds inflicted by the Komodo dragon are often associated with sepsis and subsequent infections in prey animals. How the Komodo dragon is unaffected by these virulent bacteria remains a mystery.Research in 2013 suggested that the bacteria in the mouths of komodo dragons are ordinary and similar to those found in other carnivores. They actually have surprisingly good mouth hygiene. As Bryan Fry put it: "After they are done feeding, they will spend 10 to 15 minutes lip-licking and rubbing their head in the leaves to clean their mouth... Unlike people have been led to believe, they do not have chunks of rotting flesh from their meals on their teeth, cultivating bacteria." The observation of prey dying of sepsis would then be explained by the natural instinct of water buffalos, who are not native to the islands where the Komodo dragon lives, to run into water when attacked. The warm, feces filled water would then cause the infections. The study used samples from 16 captive dragons (10 adults and six neonates) from three U.S. zoos.
VENOM
In late 2005, researchers at the University of Melbourne speculated the perentie (Varanus giganteus), other species of monitors, and agamids may be somewhat venomous. The team believes the immediate effects of bites from these lizards were caused by mild envenomation. Bites on human digits by a lace monitor (V. varius), a Komodo dragon, and a spotted tree monitor (V. scalaris) all produced similar effects: rapid swelling, localized disruption of blood clotting, and shooting pain up to the elbow, with some symptoms lasting for several hours.
In 2009, the same researchers published further evidence demonstrating Komodo dragons possess a venomous bite. MRI scans of a preserved skull showed the presence of two glands in the lower jaw. The researchers extracted one of these glands from the head of a terminally ill specimen in the Singapore Zoological Gardens, and found it secreted several different toxic proteins. The known functions of these proteins include inhibition of blood clotting, lowering of blood pressure, muscle paralysis, and the induction of hypothermia, leading to shock and loss of consciousness in envenomated prey. As a result of the discovery, the previous theory that bacteria were responsible for the deaths of Komodo victims was disputed.
Kurt Schwenk, an evolutionary biologist at the University of Connecticut, finds the discovery of these glands intriguing, but considers most of the evidence for venom in the study to be "meaningless, irrelevant, incorrect or falsely misleading". Even if the lizards have venom-like proteins in their mouths, Schwenk argues, they may be using them for a different function, and he doubts venom is necessary to explain the effect of a Komodo dragon bite, arguing that shock and blood loss are the primary factors.
Other scientists such as Washington State University's Biologist Kenneth V. Kardong and Toxicologists Scott A. Weinstein and Tamara L. Smith, have stated that this allegation of venom glands "has had the effect of underestimating the variety of complex roles played by oral secretions in the biology of reptiles, produced a very narrow view of oral secretions and resulted in misinterpretation of reptilian evolution". According to these scientists "reptilian oral secretions contribute to many biological roles other than to quickly dispatch prey". These researchers concluded that, "Calling all in this clade venomous implies an overall potential danger that does not exist, misleads in the assessment of medical risks, and confuses the biological assessment of squamate biochemical systems".
REPRODUCTION
Mating occurs between May and August, with the eggs laid in September. During this period, males fight over females and territory by grappling with one another upon their hind legs, with the loser eventually being pinned to the ground. These males may vomit or defecate when preparing for the fight. The winner of the fight will then flick his long tongue at the female to gain information about her receptivity. Females are antagonistic and resist with their claws and teeth during the early phases of courtship. Therefore, the male must fully restrain the female during coitus to avoid being hurt. Other courtship displays include males rubbing their chins on the female, hard scratches to the back, and licking. Copulation occurs when the male inserts one of his hemipenes into the female's cloaca. Komodo dragons may be monogamous and form "pair bonds", a rare behavior for lizards. Female Komodos lay their eggs from August to September and may use several types of locality; in one study, 60% laid their eggs in the nests of orange-footed scrubfowl (a moundbuilder or megapode), 20% on ground level and 20% in hilly areas. The females make many camouflage nests/holes to prevent other dragons from eating the eggs. Clutches contain an average of 20 eggs, which have an incubation period of 7–8 months. Hatching is an exhausting effort for the neonates, which break out of their eggshells with an egg tooth that falls off soon after. After cutting themselves out, the hatchlings may lie in their eggshells for hours before starting to dig out of the nest. They are born quite defenseless and are vulnerable to predation. Sixteen youngsters from a single nest were on average 46.5 cm long and weighed 105.1 grams. Young Komodo dragons spend much of their first few years in trees, where they are relatively safe from predators, including cannibalistic adults, as juvenile dragons make up 10% of their diets. The habit of cannibalism may be advantageous in sustaining the large size of adults, as medium-sized prey on the islands is rare. When the young approach a kill, they roll around in fecal matter and rest in the intestines of eviscerated animals to deter these hungry adults. Komodo dragons take approximately three to five years to mature, and may live for up to 50 years.
PARTHENOGENESIS
A Komodo dragon at London Zoo named Sungai laid a clutch of eggs in late 2005 after being separated from male company for more than two years. Scientists initially assumed she had been able to store sperm from her earlier encounter with a male, an adaptation known as superfecundation. On 20 December 2006, it was reported that Flora, a captive Komodo dragon living in the Chester Zoo in England, was the second known Komodo dragon to have laid unfertilized eggs: she laid 11 eggs, and seven of them hatched, all of them male. Scientists at Liverpool University in England performed genetic tests on three eggs that collapsed after being moved to an incubator, and verified Flora had never been in physical contact with a male dragon. After Flora's eggs' condition had been discovered, testing showed Sungai's eggs were also produced without outside fertilization. On 31 January 2008, the Sedgwick County Zoo in Wichita, Kansas, became the first zoo in the Americas to document parthenogenesis in Komodo dragons. The zoo has two adult female Komodo dragons, one of which laid about 17 eggs on 19–20 May 2007. Only two eggs were incubated and hatched due to space issues; the first hatched on 31 January 2008, while the second hatched on 1 February. Both hatchlings were males.
Komodo dragons have the ZW chromosomal sex-determination system, as opposed to the mammalian XY system. Male progeny prove Flora's unfertilized eggs were haploid (n) and doubled their chromosomes later to become diploid (2n) (by being fertilized by a polar body, or by chromosome duplication without cell division), rather than by her laying diploid eggs by one of the meiosis reduction-divisions in her ovaries failing. When a female Komodo dragon (with ZW sex chromosomes) reproduces in this manner, she provides her progeny with only one chromosome from each of her pairs of chromosomes, including only one of her two sex chromosomes. This single set of chromosomes is duplicated in the egg, which develops parthenogenetically. Eggs receiving a Z chromosome become ZZ (male); those receiving a W chromosome become WW and fail to develop, meaning that only males are produced by parthenogenesis in this species.
It has been hypothesized that this reproductive adaptation allows a single female to enter an isolated ecological niche (such as an island) and by parthenogenesis produce male offspring, thereby establishing a sexually reproducing population (via reproduction with her offspring that can result in both male and female young). Despite the advantages of such an adaptation, zoos are cautioned that parthenogenesis may be detrimental to genetic diversity.
HISTORY
DISCOVERY BY THE WESTERN WORLD
Komodo dragons were first documented by Europeans in 1910, when rumors of a "land crocodile" reached Lieutenant van Steyn van Hensbroek of the Dutch colonial administration. Widespread notoriety came after 1912, when Peter Ouwens, the director of the Zoological Museum at Bogor, Java, published a paper on the topic after receiving a photo and a skin from the lieutenant, as well as two other specimens from a collector. The first two live Komodo dragons to arrive in Europe were exhibited in the Reptile House at London Zoo when it opened in 1927. Joan Beauchamp Procter made some of the earliest observations of these animals in captivity and she demonstrated the behaviour of one of these animals at a Scientific Meeting of the Zoological Society of London in 1928. The Komodo dragon was the driving factor for an expedition to Komodo Island by W. Douglas Burden in 1926. After returning with 12 preserved specimens and 2 live ones, this expedition provided the inspiration for the 1933 movie King Kong. It was also Burden who coined the common name "Komodo dragon." Three of his specimens were stuffed and are still on display in the American Museum of Natural History.
STUDIES
The Dutch, realizing the limited number of individuals in the wild, outlawed sport hunting and heavily limited the number of individuals taken for scientific study. Collecting expeditions ground to a halt with the occurrence of World War II, not resuming until the 1950s and 1960s, when studies examined the Komodo dragon's feeding behavior, reproduction, and body temperature. At around this time, an expedition was planned in which a long-term study of the Komodo dragon would be undertaken. This task was given to the Auffenberg family, who stayed on Komodo Island for 11 months in 1969. During their stay, Walter Auffenberg and his assistant Putra Sastrawan captured and tagged more than 50 Komodo dragons. The research from the Auffenberg expedition would prove to be enormously influential in raising Komodo dragons in captivity. Research after that of the Auffenberg family has shed more light on the nature of the Komodo dragon, with biologists such as Claudio Ciofi continuing to study the creatures.
CONSERVATION
The Komodo dragon is a vulnerable species and is on the IUCN Red List. There are approximately 4,000 to 5,000 living Komodo dragons in the wild. Their populations are restricted to the islands of Gili Motang (100), Gili Dasami (100), Rinca (1,300), Komodo (1,700), and Flores (perhaps 2,000). However, there are concerns that there may presently be only 350 breeding females. To address these concerns, the Komodo National Park was founded in 1980 to protect Komodo dragon populations on islands including Komodo, Rinca, and Padar. Later, the Wae Wuul and Wolo Tado Reserves were opened on Flores to aid with Komodo dragon conservation.
Komodo dragons avoid encounters with humans. Juveniles are very shy and will flee quickly into a hideout if a human comes closer than about 100 metres. Older animals will also retreat from humans from a shorter distance away. If cornered, they will react aggressively by gaping their mouth, hissing, and swinging their tail. If they are disturbed further, they may start an attack and bite. Although there are anecdotes of unprovoked Komodo dragons attacking or preying on humans, most of these reports are either not reputable or caused by defensive bites. Only a very few cases are truly the result of unprovoked attacks by abnormal individuals, which lost their fear towards humans.
Volcanic activity, earthquakes, loss of habitat, fire, loss of prey due to poaching, tourism, and illegal poaching of the dragons themselves have all contributed to the vulnerable status of the Komodo dragon. Under Appendix I of CITES (the Convention on International Trade in Endangered Species), commercial trade of skins or specimens is illegal.
On Padar, a former population of the Komodo dragon became extinct, of which the last individuals were seen in 1975. It is widely assumed that the Komodo dragon died out on Padar after a strong decline of the populations of large ungulate prey, for which poaching was most likely responsible.
IN CAPTIVITY
Komodo dragons have long been great zoo attractions, where their size and reputation make them popular exhibits. They are, however, rare in zoos because they are susceptible to infection and parasitic disease if captured from the wild, and do not readily reproduce. As of May 2009, there were 13 European, 2 African, 35 North American, 1 Singaporean, and 2 Australian institutions that kept Komodo dragons.
The first Komodo dragons were displayed at London Zoo in 1927. A Komodo dragon was exhibited in 1934 at the National Zoo in Washington, D.C., but it lived for only two years. More attempts to exhibit Komodo dragons were made, but the lifespan of these animals was very short, averaging five years in the National Zoological Park. Studies done by Walter Auffenberg, which were documented in his book The Behavioral Ecology of the Komodo Monitor, eventually allowed for more successful managing and reproducing of the dragons in captivity.
A variety of behaviors have been observed from captive specimens. Most individuals are relatively tame within a short time, and are capable of recognizing individual humans and discriminating between familiar keepers. Komodo dragons have also been observed to engage in play with a variety of objects, including shovels, cans, plastic rings, and shoes. This behavior does not seem to be "food-motivated predatory behavior".
Even seemingly docile dragons may become unpredictably aggressive, especially when the animal's territory is invaded by someone unfamiliar. In June 2001, a Komodo dragon seriously injured Phil Bronstein, the then husband of actress Sharon Stone, when he entered its enclosure at the Los Angeles Zoo after being invited in by its keeper. Bronstein was bitten on his bare foot, as the keeper had told him to take off his white shoes and socks, which the keeper stated could potentially excite the Komodo dragon as they were the same color as the white rats the zoo fed the dragon. Although he escaped, Bronstein needed to have several tendons in his foot reattached surgically.
IN POPULARE CULTURE
Komodo dragons are used as a main theme in Komodo (1999), Curse of the Komodo (2004) and Komodo vs. Cobra (2005).
The comedy team of Bob and Ray performed a popular sketch entitled "The Komodo Dragon Expert."
The plot of the 1990 film, The Freshman, involves a university freshman, an aging mobster and a Komodo dragon.
In the 2012 James Bond film Skyfall, one of the Chinese henchmen in a casino that Bond visits in Macau is overtaken, dragged off and presumably killed by a Komodo dragon.
WIKIPEDIA
Sandakan memorial Park
Check this site :
www.sabahtourism.com/sabah-malaysian-borneo/en/destinatio...
Years after I watched this as a kid, I'm struck by how much Jetson's desk here resembles my own, and how he complains about his button pushing finger and everyone I know complains about their keyboard mashing wrists and how everyone I know has multiple giant monitors like this.
For this stark, spellbinding episode of Room 205, director Luis Farfan worked closely with director of photography Conor Simpson, set designer Tamarra Younis, editor Forrest Borie and sound engineer Jon Gilbert to capture the band's mesmerizing live performance while crafting a world of abstract symbols, ambient sounds and cinematic contrasts, entirely elegant and arresting in their own right.
BIO
Los Angeles based artist Camella Lobo has been quietly releasing music under the moniker Tropic Of Cancer since 2009. Drenched in romanticism and soaked in themes of solitude, mortality and love, her music forms a strangely hypnotic connection with its listener. Lobo’s majestic vocals, warmly cradled by waves of ascending synths, plangent guitar, and foreboding beats, summon the listener into a world of dark decadence and delicate beauty. Formerly a duo with minimal electronic artist, Silent Servant, Lobo has enlisted the assistance of Taylor Burch to help execute her music in a live setting.
COMPONENTS
Video
• YouTube: youtube.com/playlist?list=PLC4EEUwd7e4ljPXq6_9pILRONJzR-PS6z
• Vimeo: vimeo.com/album/2243798
Photos
• Flickr: flic.kr/s/aHsjA3Cd1q
Music
• SoundCloud: soundcloud.com/goincase/sets/tropic-of-cancer-at-room-205
CREDITS
Executive Producer
• Incase: goincase.com
Producer
• Arlie Carstens: disastercasual.typepad.com
Director
• Luis Farfan: denada.org
Set Designer
• Tamarra Younis: union-of-art.net
Audio Engineer
• Jon Gilbert: facebook.com/jonathan.gilbert.7796
Camera
• Luis Farfan: denada.org
• Conor Simpson: vimeo.com/likeamaniac
Editor
• Forrest Borie: vimeo.com/forrestborie
Photos
• Arlie Carstens: disastercasual.typepad.com
Performing Artist
• Tropic Of Cancer: facebook.com/tropicofcancerband
Label
• Blackest Ever Black: blackesteverblack.blogspot.com
Publicity
• Camella Lobo: twitter.com/camellalobo
Room 205 Theme Song
• Cora Foxx: theheapsf.com
October, 1999: I finally got my new big dual monitor setup at work and I thought I was so cool. Used a video camera to take this picture.
Damn, those monitors were heavy. 60 lbs. each! And it hurts my eyes just to think about looking at them. Hitachi RasterOps Mc 8115 / 8135HR
POSTER - LOCANDINA -
www.chiesasarda.it/wp-content/uploads/2020/11/de-andre_la...

www.900letterario.it/wp-content/uploads/2014/06/fabrizio-...
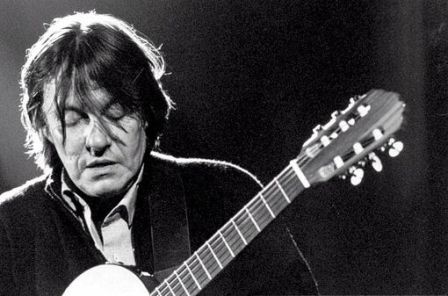
img.ubiklibri.it/images/9788896212042_0_900_0_0.jpg

www.musiculturaonline.it/p/wp-content/uploads/2021/02/b-M...

Phrases from “The Good News - Frasi da “La Buona Novella” –
In the pity that does not give in to rancor, mother, I learned love.
Nella pietà che non cede al rancore, madre, ho imparato l’amore.
(il testamento di Tito);
I don't want to think of you as the son of God, but as the son of man, my brother too.
Non voglio pensarti figlio di Dio, ma figlio dell’uomo, fratello anche mio.
(Laudate Hominem);
If you had not been the son of God, I would still have you as my son.
Non fossi stato figlio di Dio, t’avrei ancora per figlio mio.
(Tre Madri);
……………………..
Alda Merini:
“The Cross is not a Roman pole, but the wood on which God wrote his gospel”.
“La Croce non è un palo dei romani, ma il legno su cui Dio ha scritto il suo vangelo.
----------------------------------------------------------
click to activate the small icon of slideshow: the small triangle inscribed in the small rectangle, at the top right, in the photostream (it means the monitor);
or…. Press the “L” button to zoom in the image;
clicca sulla piccola icona per attivare lo slideshow: sulla facciata principale del photostream, in alto a destra c'è un piccolo rettangolo (rappresenta il monitor) con dentro un piccolo triangolo nero;
oppure…. premi il tasto “L” per ingrandire l'immagine;
www.worldphoto.org/sony-world-photography-awards/winners-...
www.fotografidigitali.it/gallery/2726/opere-italiane-segn...
………………………………………………………
Good Friday is an anniversary which in Sicily acquires a cathartic meaning for those who are searching, not only photographically, for popular traditions (we find them widespread throughout Sicily), which are nothing other than a social, cultural event, which merge into a single past and present; from the web "popular traditions are a historical memory linked to customs and rituals that have given shape to the values and beliefs of that culture". Easter in Sicily can be a source of research, it can appear not without contradictions, citing the thoughts of that great Sicilian thinker Leonardo Sciascia, for him Sicily cannot be called Christian referring to the Sicilian festivals, at most it is only in appearance, in those properly pagan explosions tolerated by the Church; Sciascia addresses the topic as an introductory essay in the book "Religious celebrations in Sicily", illustrated with photographs of a young and still unknown Ferdinando Scianna, a book that did not fail to raise some controversy due to the Sicilian thinker's introductory note, thus being in open controversy with the sacredness of that popular Sicilian devotion (the book was criticized by the Holy See newspaper, the Osservatore Romano), Sciascia writes: “what is a religious festival in Sicily? It would be easy to answer that it is anything but a religious holiday. It is, first of all, an existential explosion; the explosion of the collective id, where the collectivity exists only at the level of the id. Since it is only during the celebration that the Sicilian emerges from his condition of a single man, which is the condition of his vigilant and painful superego, to find himself part of a class, of a class, of a city". Another Sicilian thinker, writer and poet, Gesualdo Bufalino, provides interesting indications on the meaning that Sicilians give to these traditional popular events, he says "during Easter every Sicilian feels not only a spectator, but an actor, first sorrowful and then exultant , for a Mystery that is its very existence. The time of the event is that of Spring, the season of metamorphosis, just as the very nature of the rite is metamorphic in which, as in a story from the Puppet Opera, the battle of Good against Evil is fought. Deception, Pain and Triumph, Passion, Death and Resurrection of Christ are present."
In short, Easter in Sicily is a deeply felt anniversary throughout the island since ancient times, it has always had as its fulcrum the emotional participation of the people, with representations and processions which have become rites and traditions which unequivocally characterize numerous Sicilian centres, which they recall the most salient moments narrated in the Gospels and which recall the Passion, Death and Resurrection of Jesus Christ, with processions formed by the various brotherhoods (sometimes with theatrical re-enactments) which have within them contents and symbols often coming from the Spanish domination, which took place in Sicily between the 16th and 17th centuries
This year, for Good Friday, I was looking for traditions that were "outside the most well-known circuits", in the past I have alternated traditional religious processions known, with lesser-known ones; I considered various possibilities, then I decided to go to a town that is described as being located in a remote and isolated location in the province of Messina, the town is Capizzi. Good Friday in Capizzi takes place in two phases, there is the daytime procession in which three floats are carried on the shoulders, that of the Ecce Homo, that of the Sorrowful Virgin, and that of the Pietà (with the Virgin Mary holding her Dead Son in her arms), then there is the afternoon procession, which continues until late in the evening, in this evening procession the float carrying the Ecce Homo is missing, while two others are added, there is the one with the Urn carrying the Dead Christ (this figure, that of the Dead Christ, in Capizzi, is called "Father of Divine Providence"), and there is the float carrying the "Holy Cross", on it, during the route along the streets of the town, you can see the villagers placing long linen sheets, who often lean out directly from the balconies or windows of their houses to place them over it. The procession is made up of devotees and local personalities, the police and Capizzi's musical band, and two brotherhoods, that of the SS. Sacrament (the brothers are recognizable by a light yellow cloak), and that of the Good Death (whose followers wear a black cloak); the procession advances along the route in absolute silence, silence is Sacred, the bells stop ringing, the procession walks slowly, an exception to the silence comes from the sad, mournful music played by the band and the drumbeats played in mourning; the route includes steep descents, and equally steep (and tiring) climbs. The afternoon-evening procession reaches the locality of "Tre Croci", here the Archpriest, Don Antonio, delivered his panegyric, using profound words, full of Hope, Charity, Love, remembering that Christ always forgives everyone. In the afternoon, in the Mother Church, the celebration of the Passion of Christ takes place; we witness the rite of the Adoration of the Holy Cross, and the veneration of the "Father of Divine Providence", subsequently there is the rite in which the Archpriest sprinkles the body of the Dead Christ with rose petals, and anoints it with perfumed oils (to recall what is written in the Gospel of John (19:38-42), Joseph of Arimathea, a disciple of Jesus, secretly for fear of the Jews, asked Pilate for permission to take the body of Jesus, Pilate agreed, but Nicodemus also joined Joseph, carrying about thirty kilos of a mixture of myrrh and aloe, sprinkling it on the body: they took the body of Jesus, wrapped it in bandages together with the aromas, according to the funeral custom of the Jews). During the rite of the Adoration of the Cross, in the Mother Church (and also in the Tre Croci area), there is a song sung by the young people of the village, who in chorus sing the “song of the improperia”, which would be in sung form the reproaches that Jesus Christ addresses to his people, because they were responsible for His crucifixion: it is therefore a plaintive dialogue between the crucified Christ and his people; this song dates back to the sixth century, having arrived in the West from the Church of Jerusalem.
…………………………………………………
Il Venerdì Santo è una ricorrenza che in Sicilia acquista un significato catartico per chi è alla ricerca, non solo fotografica, delle tradizioni popolari (le troviamo diffuse in tutta la Sicilia), che altro non sono che un evento sociale, culturale, che fondono in un tutt’uno passato e presente; dal web “le tradizioni popolari sono una memoria storica legata ad usanze e ritualità che hanno dato forma ai valori e alle credenze di quella cultura”. La Pasqua in Sicilia può essere fonte di ricerca, essa può apparire non priva di contraddizioni, citando il pensiero di quel grande pensatore Siciliano che fu Leonardo Sciascia, per lui la Sicilia non può dirsi cristiana riferendosi alle feste Siciliane, al massimo lo è solo in apparenza, in quelle esplosioni propriamente pagane, tollerate dalla Chiesa; Sciascia affronta l’argomento come saggio introduttivo nel libro “Feste religiose in Sicilia”, illustrato con fotografie di un giovane ed ancora sconosciuto Ferdinando Scianna, libro che non mancò di sollevare qualche polemica per la nota introduttiva del pensatore Siciliano, essendo così in aperta polemica con la sacralità di quella devozione popolare Siciliana (il libro fu oggetto di una stroncatura da parte del quotidiano della Santa Sede, l’Osservatore Romano), Sciascia scrive: “che cos’ è una festa religiosa in Sicilia? Sarebbe facile rispondere che è tutto, tranne che una festa religiosa. E’, innanzi tutto, un’esplosione esistenziale; l’esplosione dell’es collettivo, dove la collettività esiste soltanto a livello dell’es. Poiché e soltanto nella festa che il siciliano esce dalla sua condizione di uomo solo, che è poi la condizione del suo vigile e doloroso super io, per ritrovarsi parte di un ceto, di una classe, di una città ”. Altro pensatore, scrittore e poeta Siciliano, Gesualdo Bufalino, fornisce indicazioni interessanti sul senso che i Siciliani danno a questi eventi popolari tradizionali, egli dice “durante la Pasqua ogni siciliano si sente non solo uno spettatore, ma un attore, prima dolente e poi esultante, per un Mistero che è la sua stessa esistenza. Il tempo dell’evento è quello della Primavera, la stagione della metamorfosi, così come metamorfica è la natura stessa del rito nel quale, come in un racconto dell’Opera dei Pupi, si combatte la lotta del Bene contro il Male. Sono presenti l’Inganno, il Dolore e il Trionfo, la Passione, la Morte e la Resurrezione di Cristo”.
In breve, la Pasqua in Sicilia è una ricorrenza profondamente sentita in tutta l’isola fin dall’antichità, essa ha sempre avuto come fulcro la commossa partecipazione del popolo, con rappresentazioni e processioni divenuti riti e tradizioni che caratterizzano inequivocabilmente numerosissimi centri Siciliani, che rievocano i momenti più salienti narrati nei Vangeli e che ricordano la Passione, la Morte e la Resurrezione di Gesù Cristo, con cortei formati dalle varie confraternite (a volte con rievocazioni teatrali) che hanno in se contenuti e simbologie spesso provenienti dalla dominazione Spagnola, avvenuta in Sicilia tra il XVI ed il XVII secolo.
Quest’anno, per il Venerdì Santo, ero alla ricerca di tradizioni che fossero “al di fuori dei circuiti più noti”, in passato ho alternato processioni tradizionali religiose note, a quelle meno note; ho preso in considerazione diverse possibilità, poi ho deciso di recarmi in un paese che viene descritto essere situato in una località remota ed isolata della provincia di Messina, il paese è Capizzi. Il Venerdì Santo a Capizzi, si svolge in due fasi, c’è la processione diurna nella quale vengono portate in spalla tre vare, quella dell’Ecce Homo, quella della Vergine Addolorata, e quella della Pietà (con la Vergine Maria che tiene in braccio suo Figlio Morto), poi c’è la processione del pomeriggio, che prosegue fino a sera inoltrata, in questa processione serale manca la vara che reca l’Ecce Homo, mentre se ne aggiungono altre due, c’è quella con l’Urna che reca il Cristo Morto ( questa figura, quella del Cristo Morto, a Capizzi, viene chiamata “Padre della Divina Provvidenza”), e c’è la vara che reca la “Santa Croce”, su di essa, durante il percorso lungo le vie del paese, si assiste al poggiare di lunghe lenzuola di lino da parte dei paesani, che spesso si sporgono direttamente dai balconi o dalle finestre delle loro case per deporle a scavalco su di essa. La processione è formate, oltre che dai devoti e dalle personalità del paese, dalle forze dell’ordine e dalla banda musicale di Capizzi, da due confraternite, quella del SS. Sacramento (i confratelli sono riconoscibili da un mantello giallo chiaro), e quella della Buona Morte (i cui adepti recano un mantello nero); la processione avanza lungo il percorso in assoluto silenzio, il silenzio è Sacro, le campane smettono di suonare, la processione cammina lenta, una eccezione al silenzio proviene dalla musica mesta, triste, suonata dalla banda e dai colpi di tamburo suonati a lutto; il percorso prevede ripide discese, ed altrettanto ripide (e faticose) salite. La processione pomeridiana-serale giunge fino alla località “Tre Croci”, qui l’Arciprete, Don Antonio, ha proferito il suo panegirico, usando parole profonde, colme di Speranza, Carità, Amore, ricordando che Cristo perdona sempre, tutti. Il pomeriggio, in Chiesa Madre, si assiste alla celebrazione della Passione di Cristo; si assiste al rito dell’Adorazione della Santa Croce, ed alla venerazione del “Padre della Divina Provvidenza”, successivamente c’è il rito nel quale l’Arciprete cosparge il corpo del Cristo Morto con petali di rosa, e lo unge con olii profumati (a rievocare quante scritto nel Vangelo di Giovanni (19:38-42), Giuseppe di Arimatea, discepolo di Gesù, in segreto per timore dei Giudei, chiese a Pilato il permesso di prendere il corpo di Gesù, Pilato acconsentì, ma anche Nicodemo, si unì a Giuseppe, portando circa trenta chili di una mistura di mirra e di aloe, cospargendone il corpo: essi presero il corpo di Gesù, lo avvolsero in bende insieme con gli aromi, secondo l'usanza funebre dei Giudei). Durante il rito dell’Adorazione della Croce, in Chiesa Madre (ed anche in località Tre Croci), c’è il canto intonato dai giovani del paese, che in coro cantano il “canto degli improperia”, che sarebbe in forma cantata i rimproveri che Gesù Cristo rivolge al suo popolo, poiché si è reso responsabile della Sua crocifissione: esso è quindi un dialogo lamentoso tra Cristo crocifisso e il suo popolo; questo canto risalirebbero al VI secolo, giunto in occidente proveniente dalla Chiesa di Gerusalemme.
………………………………………….
These arrived today from B&H to review, pretty sure two will be going back and one will become my new monitor after I am done with the review. My existing Samsung monitor is 7 years old.
After getting ribbings for my elaborate monitor setup, I posted this pic to my old gaming forum after photoshopping a few extra monitors into the mix.
Here are some close-ups of the ironclad USS Monitor, as depicted by floodllama for the Battle of Bricksburg at BrickCon 2015.
The gun barrels are a BrickArms exclusive for this collaboration. Thanks, Will!
Water monitors are a species of reptile very common in some areas of Southeast Asia. With their extra large size (up to 3 metres) they are unlikely to go unnoticed.
This paper model is a Monzir Monitor, a fighter from the game The Tomorrow War, the papercraft is created by [unknown]. The size of finished model is about 150 (H) x 178 (W) x 82 (D) mm.
You can download the papercraft model here: Tomorrow War - Monzir Monitor Free Paper Model Download [DropBox] ...
www.papercraftsquare.com/tomorrow-war-monzir-monitor-free...
A Beautiful Mertens Water monitor taken in Litchfield National Park NT. Was very friendly and had little fear of my wife and I
Katubedda, Sri Lanka.
Does anyone know if this is a male-male fight for dominance or a male-female mating ritual?
Combined native range of all the monitor lizards
Skulls of various varanoids
Monitor lizards are lizards in the genus Varanus, the only extant genus in the family Varanidae. They are native to Africa, Asia, and Oceania, and one species is also found in the Americas as an invasive species. About 80 species are recognized.
Monitor lizards have long necks, powerful tails and claws, and well-developed limbs. The adult length of extant species ranges from 20 cm (7.9 in) in some species, to over 3 m (10 ft) in the case of the Komodo dragon, though the extinct varanid known as megalania (Varanus priscus) may have been capable of reaching lengths more than 7 m (23 ft). Most monitor species are terrestrial, but arboreal and semiaquatic monitors are also known. While most monitor lizards are carnivorous, eating eggs, smaller reptiles, fish, birds, insects, and small mammals, some also eat fruit and vegetation, depending on where they live.
Photoshop across 3 monitors, 3984x1050 res. 2 seperate 3 exposures +-2 stop, both hdred then stitched in photo shop,
+++ DISCLAIMER +++
Nothing you see here is real, even though the conversion or the presented background story might be based on historical facts. BEWARE!
Some background:
The Grumman Mohawk began as a joint Army-Marine program through the then-Navy Bureau of Aeronautics (BuAer), for an observation/attack plane that would outperform the light and vulnerable Cessna L-19 Bird Dog. In June 1956, the Army issued Type Specification TS145, which called for the development and procurement of a two-seat, twin turboprop aircraft designed to operate from small, unimproved fields under all weather conditions. It would be faster, with greater firepower, and heavier armor than the Bird Dog, which had proved very vulnerable during the Korean War.
The Mohawk's mission would include observation, artillery spotting, air control, emergency resupply, naval target spotting, liaison, and radiological monitoring. The Navy specified that the aircraft had to be capable of operating from small "jeep" escort class carriers (CVEs). The DoD selected Grumman Aircraft Corporation's G-134 design as the winner of the competition in 1957. Marine requirements contributed an unusual feature to the design: since the Marines were authorized to operate fixed-wing aircraft in the close air support (CAS) role, the mockup featured underwing pylons for rockets, bombs, and other stores, and this caused a lot of discord. The Air Force did not like the armament capability of the Mohawk and tried to get it removed. On the other side, the Marines did not want the sophisticated sensors the Army wanted, so when their Navy sponsors opted to buy a fleet oil tanker, they eventually dropped from the program altogether. The Army continued with armed Mohawks (and the resulting competence controversy with the Air Force) and also developed cargo pods that could be dropped from underwing hard points to resupply troops in emergencies.
In mid-1961, the first Mohawks to serve with U.S. forces overseas were delivered to the 7th Army at Sandhofen Airfield near Mannheim, Germany. Before its formal acceptance, the camera-carrying AO-1AF was flown on a tour of 29 European airfields to display it to the U.S. Army field commanders and potential European customers. In addition to their Vietnam and European service, SLAR-equipped Mohawks began operational missions in 1963 patrolling the Korean Demilitarized Zone.
Germany and France showed early interest in the Mohawk, and two OV-1s were field-tested by both nations over the course of several months. No direct orders resulted, though, but the German Bundesheer (Army) was impressed by the type’s performance and its capability as an observation and reconnaissance platform. Grumman even signed a license production agreement with the French manufacturer Breguet Aviation in exchange for American rights to the Atlantic maritime patrol aircraft, but no production orders followed.
This could have been the end of the OV-1 in Europe, but in 1977 the German government, primarily the interior ministry and its intelligence agency, the Bundesnachrichtendienst (BND), showed interest in a light and agile SIGINT/ELINT platform that could fly surveillance missions along the inner-German border to the GDR and also to Czechoslovakia. Beyond visual reconnaissance with cameras and IR sensors, the aircraft was to be specifically able to identify and locate secret radio stations that were frequently operated by Eastern Block agents (esp. by the GDR) all across Western Germany, but primarily close to the inner-German border due to the clandestine stations’ low power. The Bundeswehr already operated a small ELINT/ECM fleet, consisting of converted HFB 320 ‘Hansa’ business jets, but these were not suited for stealthy and inconspicuous low flight level missions that were envisioned, and they also lacked the ability to fly slowly enough to locate potential “radio nests”.
The pan and the objective were clear, but the ELINT project caused a long and severe political debate concerning the operator of such an aerial platform. Initially, the Bundesheer, who had already tested the OV-1, claimed responsibility, but the interior ministry in the form of the German customs department as well as the German police’s Federal Border Guard, the Bundesgrenzschutz and the Luftwaffe (the proper operator for fixed-wing aircraft within the German armed forces), wrestled for this competence. Internally, the debate and the project ran under the handle “Schimmelreiter” (literally “The Rider on the White Horse”), after a northern German legendary figure, which eventually became the ELINT system’s semi-official name after it had been revealed to the public. After much tossing, in 1979 the decision was made to procure five refurbished U.S. Army OV-1As, tailored to the German needs and – after long internal debates – operate them by the Luftwaffe.
The former American aircraft were hybrids: they still had the OV-1A’s original short wings, but already the OV-1D’s stronger engines and its internal pallet system for interchangeable electronics. The machines received the designation OV-1G (for Germany) and were delivered in early 1980 via ship without any sensors or cameras. These were of Western German origin, developed and fitted locally, tailored to the special border surveillance needs.
The installation and testing of the “Schimmelreiter” ELINT suite lasted until 1982. It was based on a Raytheon TI Systems emitter locator system, but it was locally adapted by AEG-Telefunken to the airframe and the Bundeswehr’s special tasks and needs. The system’s hardware was stowed in the fuselage, its sensor arrays were mounted into a pair of underwing nacelles, which occupied the OV-1’s standard hardpoints, allowing a full 360° coverage. In order to cool the electronics suite and regulate the climate in the internal equipment bays, the OV-1G received a powerful heat exchanger, mounted under a wedge-shaped fairing on the spine in front of the tail – the most obvious difference of this type from its American brethren. The exact specifications of the “Schimmelreiter” ELINT suite remained classified, but special emphasis was placed upon COMINT (Communications Intelligence), a sub-category of signals intelligence that engages in dealing with messages or voice information derived from the interception of foreign communications. Even though the “Schimmelreiter” suite was the OV-1Gs’ primary reconnaissance tool, the whole system could be quickly de-installed for other sensor packs and reconnaissance tasks (even though this never happened), or augmented by single modules, what made upgrades and mission specialization easy. Beyond the ELINT suite, the OV-1G could be outfitted with cameras and other sensors on exchangeable pallets in the fuselage, too. This typically included a panoramic camera in a wedge-shaped ventral fairing, which would visually document the emitter sensors’ recordings.
A special feature of the German OV-1s was the integration of a brand new, NATO-compatible “Link-16” data link system via a MIDS-LVT (Multifunctional Information Distribution System). Even though this later became a standard for military systems, the OV-1G broke the ground for this innovative technology. The MIDS was an advanced command, control, communications, computing and intelligence (C4I) system incorporating high-capacity, jam-resistant, digital communication links for exchange of near real-time tactical information, including both data and voice, among air, ground, and sea elements. Outwardly, the MIDS was only recognizable through a shallow antenna blister behind the cockpit.
Even though the OV-1Gs initially retained their former American uniform olive drab livery upon delivery and outfitting in German service, they soon received a new wraparound camouflage for their dedicated low-level role in green and black (Luftwaffe Norm 83 standard), which was better suited for the European theatre of operations. In Luftwaffe service, the OV-1Gs received the tactical codes 18+01-05 and the small fleet was allocated to the Aufklärungsgeschwader (AG) 51 “Immelmann”, where the machines formed, beyond two squadrons with RF-4E Phantom IIs, an independent 3rd squadron. This small unit was from the start based as a detachment at Lechfeld, located in Bavaria/Southern Germany, instead of AG 51’s home airbase Bremgarten in South-Western Germany, because Lechfeld was closer to the type’s typical theatre of operations along Western Germany’s Eastern borders. Another factor in favor of this different airbase was the fact that Lechfeld was, beyond Tornado IDS fighter bombers, also the home of the Luftwaffe’s seven HFB 320M ECM aircraft, operated by the JaBoG32’s 3rd squadron, so that the local maintenance crews were familiar with complex electronics and aircraft systems, and the base’s security level was appropriate, too.
With the end of the Cold War in 1990, the OV-1Gs role and field of operation gradually shifted further eastwards. With the inner-German Iron Curtain gone, the machines were now frequently operated along the Polish and Czech Republic border, as well as in international airspace over the Baltic Sea, monitoring the radar activities along the coastlines and esp. the activities of Russian Navy ships that operated from Kaliningrad and Saint Petersburg. For these missions, the machines were frequently deployed to the “new” air bases Laage and Holzdorf in Eastern Germany.
In American service, the OV-1s were retired from Europe in 1992 and from operational U.S. Army service in 1996. In Germany, the OV-1 was kept in service for a considerably longer time – with little problems, since the OV-1 airframes had relatively few flying hours on their clocks. The Luftwaffe’s service level for the aircraft was high and spare parts remained easy to obtain from the USA, and there were still OV-1 parts in USAF storage in Western German bases.
The German HFB 320M fleet was retired between 1993 and 1994 and, in part, replaced by the Tornado ECR. At the same time AG 51 was dissolved and the OV-1Gs were nominally re-allocated to JaboG 32/3. With this unit the OV-1Gs remained operational until 2010, undergoing constant updates and equipment changes. For instance, the machines received in 1995 a powerful FLIR sensor in a small turret in the aircraft’s nose, which improved the aircraft’s all-weather reconnaissance capabilities and was intended to spot hidden radio posts even under all-weather/night conditions, once their signal was recognized and located. The aircrafts’ radio emitter locator system was updated several times, too, and, as a passive defensive measure against heat-guided air-to-air missiles/MANPADS, an IR jammer was added, extending the fuselage beyond the tail. These machines received the suffix “Phase II”, even though all five aircraft were updated the same way.
Reports that the OV-1Gs were furthermore retrofitted with the avionics to mount and launch AIM-9 Sidewinder AAMs under the wing tips for self-defense remained unconfirmed, even more so because no aircraft was ever seen carrying arms – neither the AIM-9 nor anything else. Plans to make the OV-1Gs capable of carrying the Luftwaffe’s AGM-65 Maverick never went beyond the drawing board, either. However, BOZ chaff/flare dispenser pods and Cerberus ECM pods were occasionally seen on the ventral pylons from 1998 onwards.
No OV-1G was lost during the type’s career in Luftwaffe service, and after the end of the airframes’ service life, all five German OV-1Gs were scrapped in 2011. There was, due to worsening budget restraints, no direct successor, even though the maritime surveillance duties were taken over by Dornier Do 228/NGs operated by the German Marineflieger (naval air arm).
General characteristics:
Crew: Two: pilot, observer/systems operator
Length: 44 ft 4 in (13.53 m) overall with FLIR sensor and IR jammer
Wingspan: 42 ft 0 in (12.8 m)
Height: 12 ft 8 in (3.86 m)
Wing area: 330 sq. ft (30.65 m²)
Empty weight: 12,054 lb (5,467 kg)
Loaded weight: 15,544 lb (7,051 kg)
Max. takeoff weight: 18,109 lb (8,214 kg)
Powerplant:
2× Lycoming T53-L-701 turboprops, 1,400 shp (1,044 kW) each
Performance:
Never exceed speed: 450 mph (390 knots, 724 km/h)
Maximum speed: 305 mph (265 knots, 491 km/h) at 10,000 ft (3,050 m)
Cruise speed: 207 mph (180 knots, 334 km/h) (econ cruise)
Stall speed: 84 mph (73 knots, 135 km/h)
Range: 944 mi (820 nmi, 1,520 km) (SLAR mission)
Service ceiling: 25,000 ft (7,620 m)
Rate of climb: 3,450 ft/min (17.5 m/s)
Armament:
A total of eight external hardpoints (two ventral, three under each outer wing)
for external loads; the wing hardpoints were typically occupied with ELINT sensor pods, while the
ventral hardpoints frequently carried 300 l drop tanks to extend loiter time and range;
Typically, no offensive armament was carried, even though bombs or gun/missile pods were possible.
The kit and its assembly:
This build became a submission to the “Reconnaissance” Group Build at whatifmodellers.com in July 2021, and it spins further real-world events. Germany actually tested two OV-1s in the Sixties (by the German Army/Bundesheer, not by the air force), but the type was not procured or operated. The test aircraft carried a glossy, olive drab livery (US standard, I think) with German national markings.
However, having a vintage Hasegawa OV-1A in the stash, I wondered what an operational German OV-1 might have looked like, especially if it had been operated into the Eighties and beyond, in the contemporary Norm 83 paint scheme? This led to this purely fictional OV-1G.
The kit was mostly built OOB, and the building experience was rather so-so – after all, it’s a pretty old mold/boxing (in my case the Hasegawa/Hales kit is from 1978, the mold is from 1968!). Just a few things were modified/added in order to tweak the standard, short-winged OV-1A into something more modern and sophisticated.
When searching for a solution to mount some ELINT sensor arrays, I did not want to copy the OV-1B’s characteristic offset, ventral SLAR fairing. I rather settled for the late RV-1D’s solution with sensor pods under the outer wings. Unfortunately, the OV-1A kit came with the type’s original short wings, so that the pods had to occupy the inner underwing pair of hardpoints. The pods were scratched from square styrene profiles and putty, so that they received a unique look. The Mohawk’s pair of ventral hardpoints were mounted, but – after considering some drop tanks or an ECM pod there - left empty, so that the field of view for the ventral panoramic camera would not be obscured.
Other small additions are some radar warning sensor bumps on the nose, some extra antennae, a shallow bulge for the MIDS antenna on the spine, the FLIR turret on the nose (with parts from an Italeri AH-1 and a Kangnam Yak-38!), and I added a tail stinger for a retrofitted (scratched) IR decoy device, inspired by the American AN/ALG-147. This once was a Matchbox SNEB unguided missile pod.
Painting and markings:
For the intended era, the German Norm 83 paint scheme, which is still in use today on several Luftwaffe types like the Transall, PAH-2 or CH-53, appeared like a natural choice. It’s a tri-color wraparound scheme, consisting of RAL 6003 (Olivgrün), FS 34097 (Forest Green) and RAL 7021 (Teerschwarz). The paints I used are Humbrol 86 (which is supposed to be a WWI version of RAL 6003, it lacks IMHO yellow but has good contrast to the other tones), Humbrol 116 and Revell 9. The pattern itself was adapted from the German Luftwaffe’s Dornier Do 28D “Skyservants” with Norm 83 camouflage, because of the type’s similar outlines.
A black ink washing was applied for light weathering, plus some post-shading of panels with lighter shades of the basic camouflage tones for a more plastic look. The cockpit interior was painted in light grey (Humbrol 167), while the landing gear and the interior of the air brakes became white. The scratched SLAR pods became light grey, with flat di-electric panels in medium grey (created with decal material).
The cockpit interior was painted in a rather light grey (Humbrol 167), the pilots received typical olive drab Luftwaffe overalls, one with a white “bone dome” and the other with a more modern light grey helmet.
The decals were improvised. National markings and tactical codes came from TL Modellbau sheets, the AG 51 emblems were taken from a Hasegawa RF-4E sheet. The black walkways were taken from the Mohak’s OOB sheet, the black de-icer leading edges on wings and tail were created with generic black decal material. Finally, the model was sealed with a coat of matt acrylic varnish (Italeri).
An interesting result, and the hybrid paint scheme with the additional desert camouflage really makes the aircraft an unusual sight, adding to its credibility.