View allAll Photos Tagged maps
Map showing Angola and surrounding countries with international borders, the national capital, major cities, main roads, and railroads.
By Andrés Bentancourt
EyeEm | 500px | Flickr | Instagram | Tumblr | Twitter | DeviantArt | Pinterest | Facebook | Contact email
Remember that one illustrated map I uploaded a while back? Well, I found out that that was the back to the Cities Service Map series (its cover was torn off so I didn't know that there was a cool cover to it). Here is what the front of those maps look like. I did the eBay thing and found the best quality map that was available: Kansas.
I suggest doing the "All sizes" thing or just click here.
This map goes along with this post, which was an attempt to inventory all the independant shops and businesses in my area of central Austin.
I am reposting this map from the University of Texas so I can comment on it, because every time I look at it I see something new that's weird about it.
It is supposedly from 1913, but it looks like the street map must be earlier since the Civic Center is still in the pre-1906 configuration and street names like Ridley and Kate persist.
Montgomery Street continues straight south to 16th and Connecticut!
16th Street continues west over Corona Heights to connect to Irving!
18th Street also makes it as far west as Stanyan.
The "Right of Way for the Southern and Western Pacific Railroad" runs across Candlestick Point and into the bay, like a prototype for the Hunters Point Freeway.
Market Street continues southwest over the hills and includes what is now Sloat.
Army (Cesar Chavez) is called New Market in Noe Valley.
The Bayview/Hunter's Point streets all have different names.
The Mission grid extending west to Fowler and south to 34th Street, and the Lake Merced grid, are contrary to reality too, but those aren't unique to this map.
Source: McGraw Electric Railway Manual: The Red Book of American Electric Railway Investments, the University of Texas Libraries.
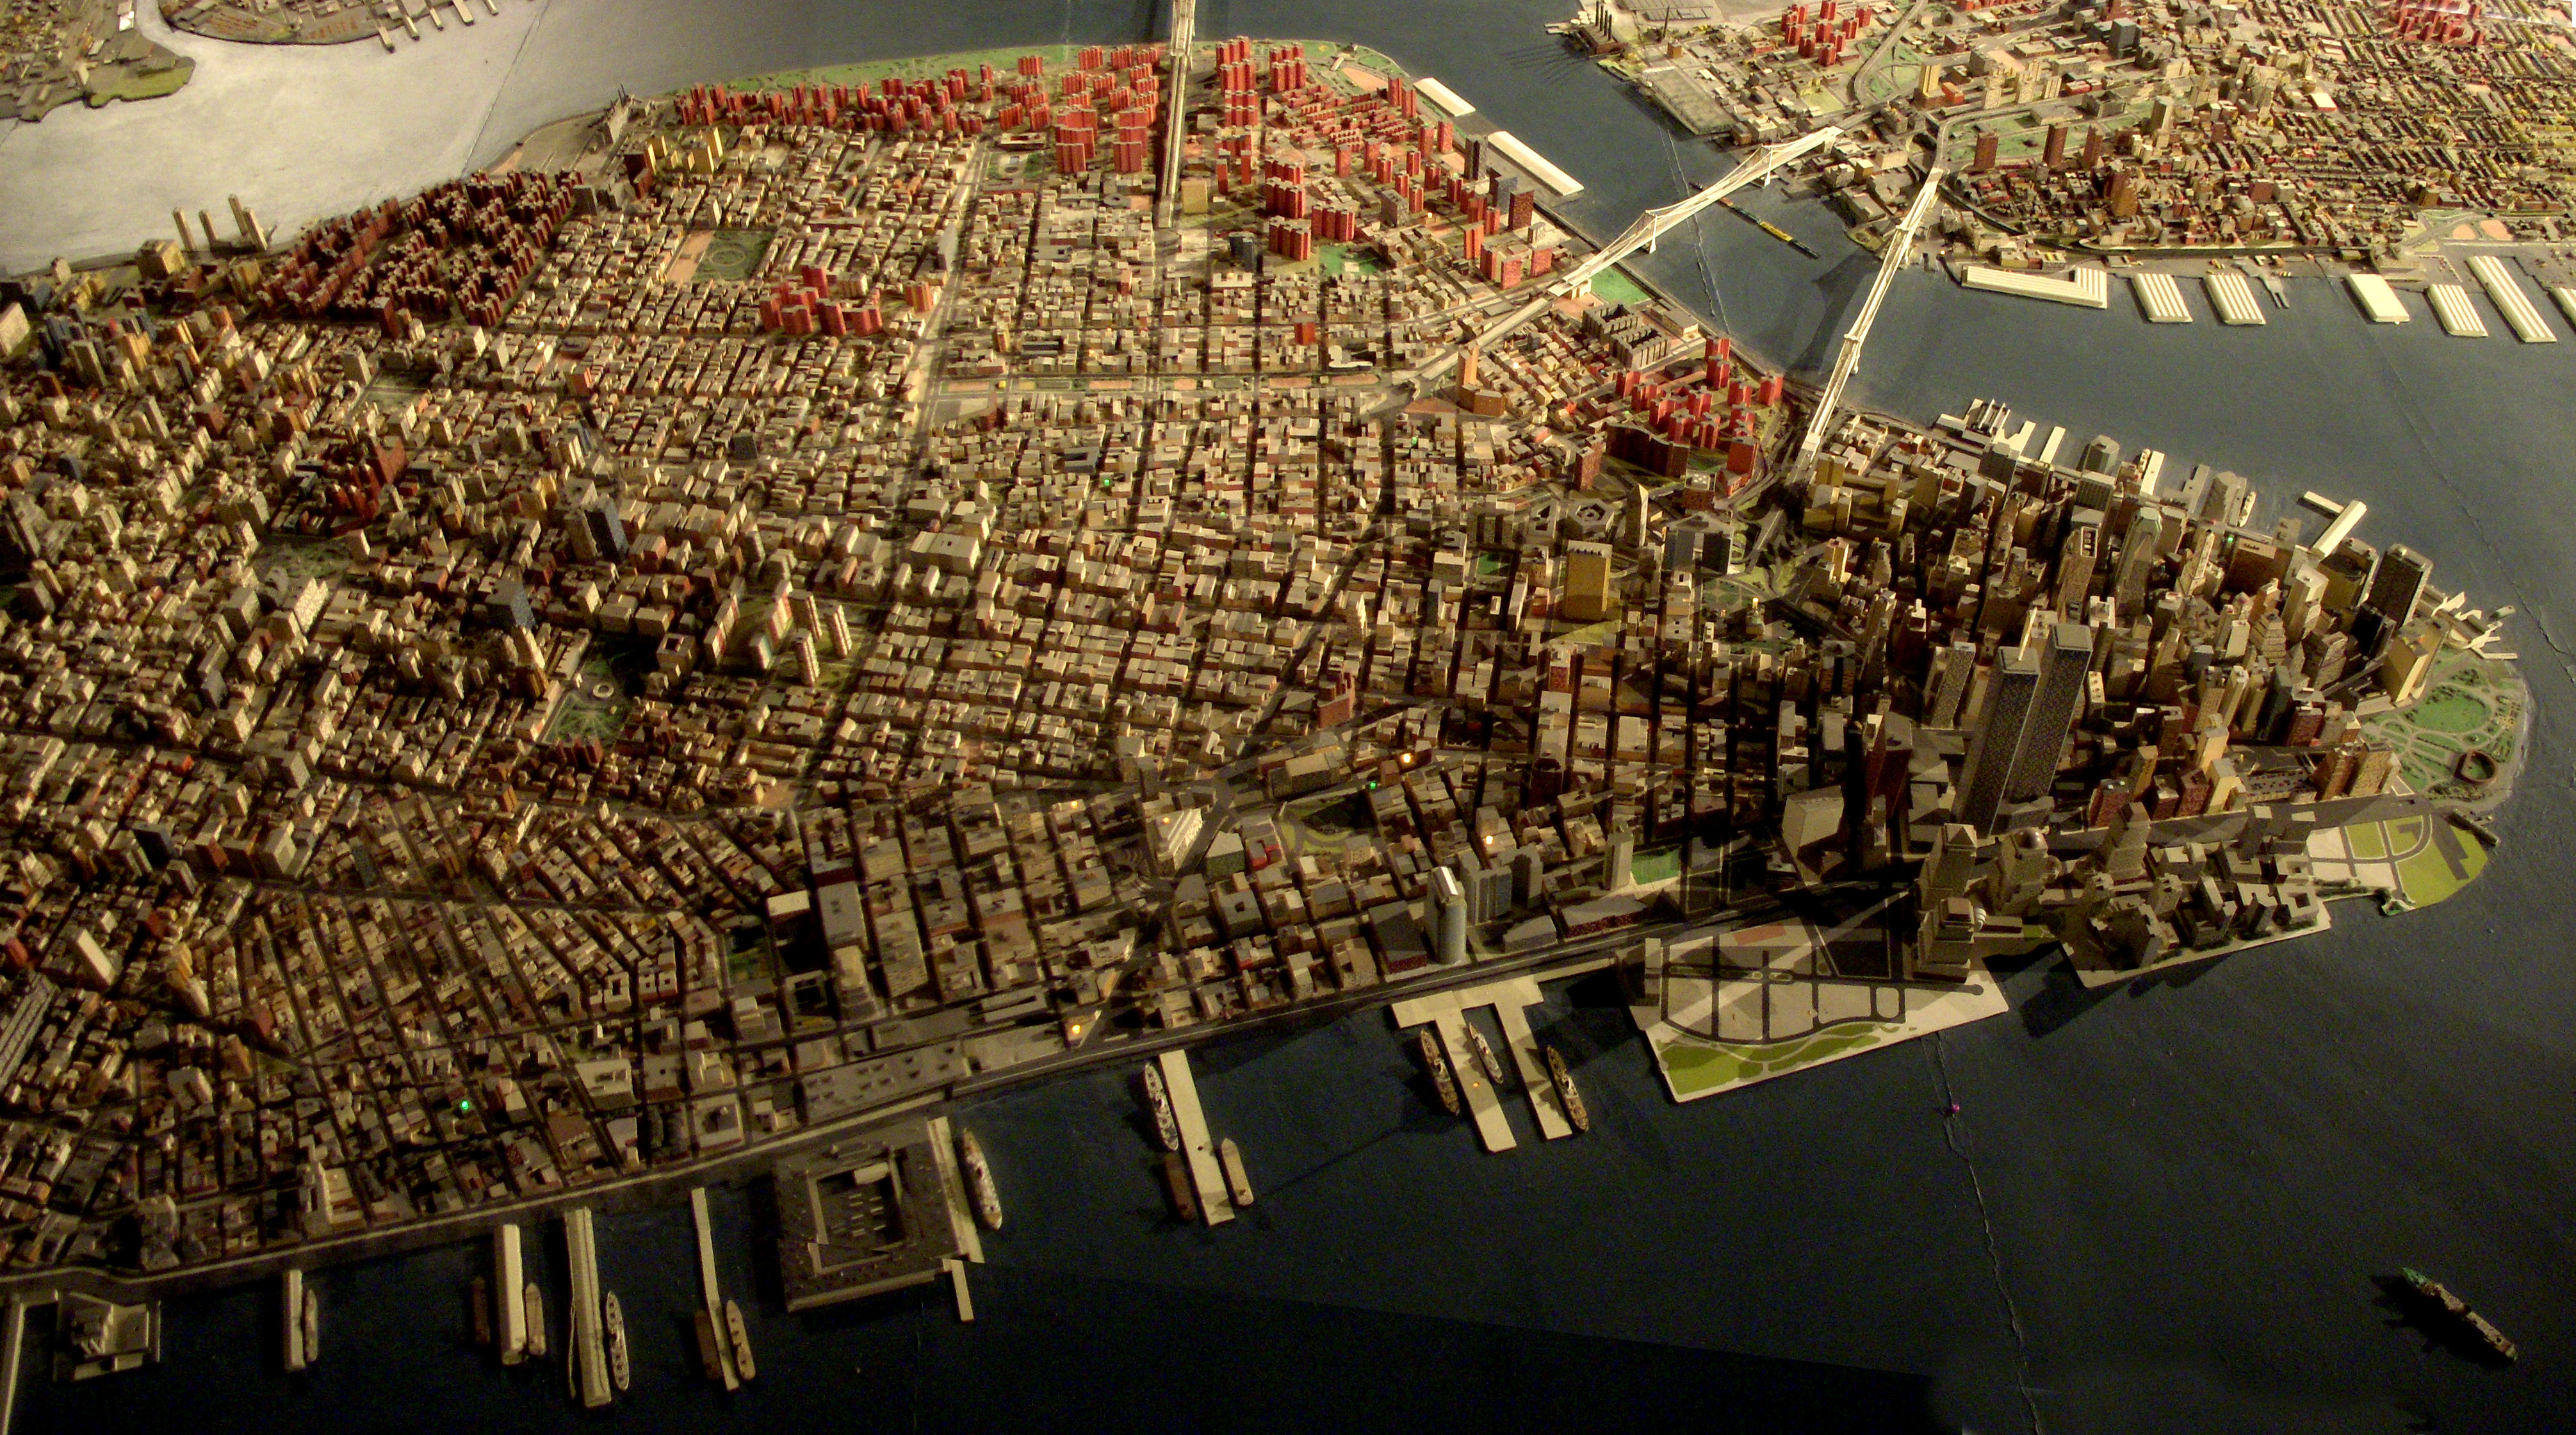
Giant map of NYC in the Queens Museum of Art. I uploaded this full size panorama of downtown Manhattan so my neighbors can have fun finding their own apartment building.
Robert Moses had 'The Panorama of the City of New York' built for the 1964 World's Fair, but it has been updated, and supposedly has every building built before 1992. Originally you flew over it on a simulate helicopter ride. Now there is a ramp that spirals around it from the first to second floor of the museum.
This is a map of Seoul with some of the places we visited.
Below are my steps to create the map:
1. Using Google Earth, I plotted the location of each attraction.
2. I printed the map and traced over it with white paper and a pencil. I drew in the river and placed an "x" for each attraction.
3. I inked-in the river and drew the landmarks. For all inking, I used a Fine Black Sharpie Pen.
4. Next I lettered each landmark.
5. After erasing all of the pencil marks, I scanned the map and added a couple of elements (Miso, and the Nanta drawing) using Paint. I also added "Han River" as I forgot to letter this by hand.
6. I printed the map onto parchment paper. Once scanned back in to my computer, I e-mailed it to myself so I could complete the editing using my iPad.
7. On my iPad, I added the Torn Brick effect and Rough Edge border.
8. Finally, I added my watermark using the iWatermark app. The watermark is a stone stamp that was created in Korea. The Korean letters phonetically spell my first name, Douglas.
Now, I want 60044. And it is my intention to be out for it on the Wensleydale this weekend.
It's a wee bit of a trek from here. But Windows maps seemingly turns a trek into an epic. This was seriously offered up as an option.
Toodle pip. Got a boat to be on...
12 July 2017
IT'S HERE!!!
We're just getting rolling now, so I'd suggest highly that you make your way over there if any of you are interested in taking over the world!
The first attack starts Friday the 12th.
Cry HAVOC! And let slip your dogs of war!
The Southwest Airlines route map in October 2020. The map shows the nine new destinations planned through June 2021.
Courtesy of Southwest Airlines.
View in Google Earth: large or original size
Planning map for BART lines and stations.
In this version, the outer reaches of the system are postponed to the future for cost reduction and the Twin Peaks Tunnel restored to being a streetcar subway.
Map from an official guide published by the Cape Town City Council in 1950. Note the railway line crossing the bottom of Adderley str. Most probably also the line that went to Sea Point.
This is a close up of an old map I carry around while exploring Honolulu's Chinatown.
I've linked a few of my pinhole photographs taken in this area [click on notes in map above].
More photos in my Chinatown series.
Map courtesy: University of Hawaiʻi at Mānoa Library, Map Collection
Sanborn Fire Insurance Map, Honolulu, 1914, sheet 37 [cropped].
2560sqm, 878 land capacity, Laka. Protected navigable lot for rent in volcanic islands & Linden Waterfalls. Beautiful home furnished and landscaped. Waterfall, and enough water for medium sized boat. Lot is for sale or rent.
In the new square at Trondheim, this map of the river Nidelven has been made. Really nicely done.
Digitized with Negative Lab Pro v2.1.0
Maps of racial and ethnic divisions in US cities, inspired by Bill Rankin's map of Chicago, updated for Census 2010.
Red is White, Blue is Black, Green is Asian, Orange is Hispanic, Yellow is Other, and each dot is 25 residents.
Data from Census 2010. Base map © OpenStreetMap, CC-BY-SA
Description: Map of Massachusetts with political boundaries and topographic relief.
Note: Map with tactile elements for use by the blind.
Creator: Perkins School for the Blind
Date: 1908
Format: map
Digital Identifier: MAPS-00032
Rights: Samuel P. Hayes Research Library, Perkins School for the Blind, Watertown, MA