View allAll Photos Tagged WebGL,
ZoomCharts is offering data visualization tools to support presenters at the Fluent conference, taking place April 20th through 22nd at the San Francisco Marriott Marquis, 780 Mission Street, San Francisco, CA 94103.
Check out what you can do with ZoomCharts charts and graphs at zoomcharts.com
ZoomCharts is a leading data visualization provider, offering the worldâs most interactive data visualization software. ZoomCharts provides fully interactive charts that support large data inputs, can be used on any modern device, and perform at incredibly fast speeds. Be among the growing number of professionals discovering the exciting potential that ZoomCharts has in improving the efficiency of data analysis and presentation.
The Fluent web conference spans three days of exciting training and tutorials, and keynotes and sessions, made for developers working with JavaScript, HTML5, CSS3, WebGL, Node.js, and other Web technologies. It provides an excellent learning opportunity for building web applications, designing for mobile devices, and working with the always evolving technologies that drive the Web platform.
The event brings together UX/UI designers, developers working in Web and mobile, software engineers, and thousands of others who work with major and emerging Web technologies, and gives them an opportunity to network, connect, and join in discussions with other members of the community.
This popular conference includes sponsors such as IBM, SAP, and Mandrill, among many others.
Guest speakers include: Marcy Sutton, Developer at Substantial, who will be giving a talk on Accessibility in AngularJS and Beyond; Divya Manian, Project Manager at Adobe, who will be speaking on Bridging the Gap Between Designers and Developers; Andreas Gal, CTO of Mozilla, giving a session on Dirty Performance Secrets of HTML5; Paul Irish, Chrome Developer Advocate at Google, who will be speaking on How Users Perceive the Speed of the Web; Axel Rauschmayer, Founder of Ecmanauten, who will be giving a session on ECMAScript 6 in Theory and Practice; and many, many more.
Check out ZoomCharts products:
Network Chart
Big network exploration
Explore linked data sets. Highlight relevant data with dynamic filters and visual styles. Incremental data loading. Exploration with focus nodes.
Time Chart
Time navigation and exploration tool
Browse activity logs, select time ranges. Multiple data series and value axes. Switch between time units.
Pie Chart
Amazingly intuitive hierarchical data exploration
Get quick overview of your data and drill down when necessary. All in a single easy to use chart.
Facet Chart
Scrollable bar chart with drill-down
Compare values side by side and provide easy access to the long tail.
ZoomCharts
The worldâs most interactive data visualization software
#zoomcharts #interactive #data #visualization #charts #graphs #bigdata #dataviz #Fluent #SanFrancisco #SF #California #CA #FluentConference #webplatform #TheWebPlatform #responsive #mobile #web #design #HTML5 #CSS3 #Javascript #WebGL #NodeJS #UX #UI #development #developers #IBM #SAP #Mandrill #AngularJS #MarcySutton #DivyaManian #AndreasGal #PaulIrish #AxelRauschmayer
This is the back side of my cyber-bikini-HD with animated LED Effects and below you can see tattoos that i made plus animated LED contact lenses.
Just to clarify again for those with a weak brain or a read weakness: The tattoos do NOT say "Pixelada for ass" and also NOT "Lamorna sucks", they say "Pixellator 4 V22" and "Ramona SLiXX"! ;)
Visit my place by clicking this link to see parts of this outfit direct in your webbrowser: a.cloudparty.com/went/SqnOdQRbo
London JS: Data Visualisation at Poke London
3D Cities and Data Visualisation with WebGL presented by Robin Hawkes
Using D3.js to visualise your analytics data presented by Edd Sowden
10 things you didn't know about D3.js presented by Anna Powell-Smith
Lanyrd: lanyrd.com/2013/londonjs-25/
London JS: Data Visualisation at Poke London
3D Cities and Data Visualisation with WebGL presented by Robin Hawkes
Using D3.js to visualise your analytics data presented by Edd Sowden
10 things you didn't know about D3.js presented by Anna Powell-Smith
Lanyrd: lanyrd.com/2013/londonjs-25/
ZoomCharts at DevClub.lv: Developing a Javascript SDK
On January 15, 2015, ZoomCharts Co-Founder and CTO Viesturs Zariņš presented at DevClub.lv - a community of Latvian IT specialists that gather monthly and host free talks, presentations, and events to allow the local IT community to share knowledge, network, and communicate. Zariņš discussed the unique challenges faced in developing JavaScript SDK.
Here is a brief overview of his PowerPoint presentation on ZoomCharts, the world’s most interactive data visualization software that will support all your data presentation needs with incredible speed.
What is ZoomCharts?
What defines ZoomCharts advanced data visualization software? It is NOT another HTML5 charts library. It is:
- Interactive
- Fast
- Touch enabled
- Supports big data
A long time ago
DOS 6.2 allowed for:
- 320x240x8bpp
- Direct access to pixels on screen
- Assembler for performance
Today, the Web has finally caught up in the graphics department. Now, we have access to:
- Multiple browsers and rendering technologies
- Multiple resolutions
- Performance that varies by browser and device
Development setup:
- We write in JavaScript
- Commit to GitHub
- Build system in JavaScript
- Debug in Chrome
- Run automated tests
- Like WebStorm (and Vim)
Graphics:
Canvas (fast)
SVG (slow)
WebGL (>50%)
Interactive animations:
Zoom in and out of the graph, drag and drop data, all with your mouse or trackpad.
Graceful degradation:
High FPS (frames per second) lets you scale graphics with low image degradation.
Third party libraries:
- Raphael
- Hammer.js
- Leaflet
- Moment.js
Challenges:
- Responsive design: layouts can shift and look nice on desktop screens vs. not so nice on vertical, mobile screens
- Big screen resolutions: uses devicePixelRatio for sharp rendering, but no hardware acceleration beyond 2048x2048
- Safari compatibility: with 100% CPU, input events are blocked and browser locks up; strange code offers fixes
- HTML on canvas: DOM is slow; basic HTML markup must be parsed and rendered manually; text caching helps
Support:
- Process: TrialSupportBuy
- 1 day issue resolution
- #1 Tell me what I did wrong
- #2 Can you do…
Testing:
- Automated tests on every GIT push
Automatically:
- Compare images
- Record performance
- View errors in console
Interactive testing:
- Next step: record and playback
BrowserStack:
- Interactive mode
- Automated: Selenium API
Debugging:
Chrome Developer tools (F12)
- Debugging
- Profiling
- Timeline
Remote debugging available: developer.chrome.com/devtools/docs/remote-debugging
Future:
- More charts
- Extension API
- Memory allocation tracking
- WebGL
We are looking for statically-typed language:
- Error checking
- Performance
- Superior minification
- Easy to write and read
- Easy to call from JS
Building
Custom build script:
- Compile
- Minify
- Extract documentation
- Embed customer data
Check out ZoomCharts products:
Network Chart
Big network exploration
Explore linked data sets. Highlight relevant data with dynamic filters and visual styles. Incremental data loading. Exploration with focus nodes.
Time Chart
Time navigation and exploration tool
Browse activity logs, select time ranges. Multiple data series and value axes. Switch between time units.
Pie Chart
Amazingly intuitive hierarchical data exploration
Get quick overview of your data and drill down when necessary. All in a single easy to use chart.
Facet Chart
Scrollable bar chart with drill-down
Compare values side by side and provide easy access to the long tail.
ZoomCharts
The world’s most interactive data visualization software
#zoomcharts #interactive #data #interactivedata #datavisualization #interactivedatavisualization #chart #graph #charts #graphs #Javascript #JavascriptSDK #DevClubIV #Latvia #PowerPoint #PowerPointpresentation #fast #bigdata
full video at vimeo.com/nervoussystem/cellcycle
app at n-e-r-v-o-u-s.com/cellCycle
music is "Day Bird" by Broke For Free brokeforfree.com
--
wow the automated thumbnail generator really picked a bad frame! don't worry the video is awesome
London JS: Data Visualisation at Poke London
3D Cities and Data Visualisation with WebGL presented by Robin Hawkes
Using D3.js to visualise your analytics data presented by Edd Sowden
10 things you didn't know about D3.js presented by Anna Powell-Smith
Lanyrd: lanyrd.com/2013/londonjs-25/
London JS: Data Visualisation at Poke London
3D Cities and Data Visualisation with WebGL presented by Robin Hawkes
Using D3.js to visualise your analytics data presented by Edd Sowden
10 things you didn't know about D3.js presented by Anna Powell-Smith
Lanyrd: lanyrd.com/2013/londonjs-25/
ZoomCharts at DevClub.lv: Developing a Javascript SDK
On January 15, 2015, ZoomCharts Co-Founder and CTO Viesturs Zariņš presented at DevClub.lv - a community of Latvian IT specialists that gather monthly and host free talks, presentations, and events to allow the local IT community to share knowledge, network, and communicate. Zariņš discussed the unique challenges faced in developing JavaScript SDK.
Here is a brief overview of his PowerPoint presentation on ZoomCharts, the world’s most interactive data visualization software that will support all your data presentation needs with incredible speed.
What is ZoomCharts?
What defines ZoomCharts advanced data visualization software? It is NOT another HTML5 charts library. It is:
- Interactive
- Fast
- Touch enabled
- Supports big data
A long time ago
DOS 6.2 allowed for:
- 320x240x8bpp
- Direct access to pixels on screen
- Assembler for performance
Today, the Web has finally caught up in the graphics department. Now, we have access to:
- Multiple browsers and rendering technologies
- Multiple resolutions
- Performance that varies by browser and device
Development setup:
- We write in JavaScript
- Commit to GitHub
- Build system in JavaScript
- Debug in Chrome
- Run automated tests
- Like WebStorm (and Vim)
Graphics:
Canvas (fast)
SVG (slow)
WebGL (>50%)
Interactive animations:
Zoom in and out of the graph, drag and drop data, all with your mouse or trackpad.
Graceful degradation:
High FPS (frames per second) lets you scale graphics with low image degradation.
Third party libraries:
- Raphael
- Hammer.js
- Leaflet
- Moment.js
Challenges:
- Responsive design: layouts can shift and look nice on desktop screens vs. not so nice on vertical, mobile screens
- Big screen resolutions: uses devicePixelRatio for sharp rendering, but no hardware acceleration beyond 2048x2048
- Safari compatibility: with 100% CPU, input events are blocked and browser locks up; strange code offers fixes
- HTML on canvas: DOM is slow; basic HTML markup must be parsed and rendered manually; text caching helps
Support:
- Process: TrialSupportBuy
- 1 day issue resolution
- #1 Tell me what I did wrong
- #2 Can you do…
Testing:
- Automated tests on every GIT push
Automatically:
- Compare images
- Record performance
- View errors in console
Interactive testing:
- Next step: record and playback
BrowserStack:
- Interactive mode
- Automated: Selenium API
Debugging:
Chrome Developer tools (F12)
- Debugging
- Profiling
- Timeline
Remote debugging available: developer.chrome.com/devtools/docs/remote-debugging
Future:
- More charts
- Extension API
- Memory allocation tracking
- WebGL
We are looking for statically-typed language:
- Error checking
- Performance
- Superior minification
- Easy to write and read
- Easy to call from JS
Building
Custom build script:
- Compile
- Minify
- Extract documentation
- Embed customer data
Check out ZoomCharts products:
Network Chart
Big network exploration
Explore linked data sets. Highlight relevant data with dynamic filters and visual styles. Incremental data loading. Exploration with focus nodes.
Time Chart
Time navigation and exploration tool
Browse activity logs, select time ranges. Multiple data series and value axes. Switch between time units.
Pie Chart
Amazingly intuitive hierarchical data exploration
Get quick overview of your data and drill down when necessary. All in a single easy to use chart.
Facet Chart
Scrollable bar chart with drill-down
Compare values side by side and provide easy access to the long tail.
ZoomCharts
The world’s most interactive data visualization software
#zoomcharts #interactive #data #interactivedata #datavisualization #interactivedatavisualization #chart #graph #charts #graphs #Javascript #JavascriptSDK #DevClubIV #Latvia #PowerPoint #PowerPointpresentation #fast #bigdata
London JS: Data Visualisation at Poke London
3D Cities and Data Visualisation with WebGL presented by Robin Hawkes
Using D3.js to visualise your analytics data presented by Edd Sowden
10 things you didn't know about D3.js presented by Anna Powell-Smith
Lanyrd: lanyrd.com/2013/londonjs-25/
London JS: Data Visualisation at Poke London
3D Cities and Data Visualisation with WebGL presented by Robin Hawkes
Using D3.js to visualise your analytics data presented by Edd Sowden
10 things you didn't know about D3.js presented by Anna Powell-Smith
Lanyrd: lanyrd.com/2013/londonjs-25/
London JS: Data Visualisation at Poke London
3D Cities and Data Visualisation with WebGL presented by Robin Hawkes
Using D3.js to visualise your analytics data presented by Edd Sowden
10 things you didn't know about D3.js presented by Anna Powell-Smith
Lanyrd: lanyrd.com/2013/londonjs-25/
ZoomCharts at DevClub.lv: Developing a Javascript SDK
On January 15, 2015, ZoomCharts Co-Founder and CTO Viesturs Zariņš presented at DevClub.lv - a community of Latvian IT specialists that gather monthly and host free talks, presentations, and events to allow the local IT community to share knowledge, network, and communicate. Zariņš discussed the unique challenges faced in developing JavaScript SDK.
Here is a brief overview of his PowerPoint presentation on ZoomCharts, the world’s most interactive data visualization software that will support all your data presentation needs with incredible speed.
What is ZoomCharts?
What defines ZoomCharts advanced data visualization software? It is NOT another HTML5 charts library. It is:
- Interactive
- Fast
- Touch enabled
- Supports big data
A long time ago
DOS 6.2 allowed for:
- 320x240x8bpp
- Direct access to pixels on screen
- Assembler for performance
Today, the Web has finally caught up in the graphics department. Now, we have access to:
- Multiple browsers and rendering technologies
- Multiple resolutions
- Performance that varies by browser and device
Development setup:
- We write in JavaScript
- Commit to GitHub
- Build system in JavaScript
- Debug in Chrome
- Run automated tests
- Like WebStorm (and Vim)
Graphics:
Canvas (fast)
SVG (slow)
WebGL (>50%)
Interactive animations:
Zoom in and out of the graph, drag and drop data, all with your mouse or trackpad.
Graceful degradation:
High FPS (frames per second) lets you scale graphics with low image degradation.
Third party libraries:
- Raphael
- Hammer.js
- Leaflet
- Moment.js
Challenges:
- Responsive design: layouts can shift and look nice on desktop screens vs. not so nice on vertical, mobile screens
- Big screen resolutions: uses devicePixelRatio for sharp rendering, but no hardware acceleration beyond 2048x2048
- Safari compatibility: with 100% CPU, input events are blocked and browser locks up; strange code offers fixes
- HTML on canvas: DOM is slow; basic HTML markup must be parsed and rendered manually; text caching helps
Support:
- Process: TrialSupportBuy
- 1 day issue resolution
- #1 Tell me what I did wrong
- #2 Can you do…
Testing:
- Automated tests on every GIT push
Automatically:
- Compare images
- Record performance
- View errors in console
Interactive testing:
- Next step: record and playback
BrowserStack:
- Interactive mode
- Automated: Selenium API
Debugging:
Chrome Developer tools (F12)
- Debugging
- Profiling
- Timeline
Remote debugging available: developer.chrome.com/devtools/docs/remote-debugging
Future:
- More charts
- Extension API
- Memory allocation tracking
- WebGL
We are looking for statically-typed language:
- Error checking
- Performance
- Superior minification
- Easy to write and read
- Easy to call from JS
Building
Custom build script:
- Compile
- Minify
- Extract documentation
- Embed customer data
Check out ZoomCharts products:
Network Chart
Big network exploration
Explore linked data sets. Highlight relevant data with dynamic filters and visual styles. Incremental data loading. Exploration with focus nodes.
Time Chart
Time navigation and exploration tool
Browse activity logs, select time ranges. Multiple data series and value axes. Switch between time units.
Pie Chart
Amazingly intuitive hierarchical data exploration
Get quick overview of your data and drill down when necessary. All in a single easy to use chart.
Facet Chart
Scrollable bar chart with drill-down
Compare values side by side and provide easy access to the long tail.
ZoomCharts
The world’s most interactive data visualization software
#zoomcharts #interactive #data #interactivedata #datavisualization #interactivedatavisualization #chart #graph #charts #graphs #Javascript #JavascriptSDK #DevClubIV #Latvia #PowerPoint #PowerPointpresentation #fast #bigdata
OpenGL ES 10th anniversary party at SIGGRAPH 2013 with the Khronos Group.
Photo copyright by NorekeFoto used with permission from NorekeFoto
The Khronos Group Booth at SIGGRAPH 2013. Photo copyright by NorekeFoto used with permission from NorekeFoto
The Khronos Group Booth at SIGGRAPH 2013. Photo copyright by NorekeFoto used with permission from NorekeFoto
The Khronos Group Booth at SIGGRAPH 2013. Photo copyright by NorekeFoto used with permission from NorekeFoto
ZoomCharts at DevClub.lv: Developing a Javascript SDK
On January 15, 2015, ZoomCharts Co-Founder and CTO Viesturs Zariņš presented at DevClub.lv - a community of Latvian IT specialists that gather monthly and host free talks, presentations, and events to allow the local IT community to share knowledge, network, and communicate. Zariņš discussed the unique challenges faced in developing JavaScript SDK.
Here is a brief overview of his PowerPoint presentation on ZoomCharts, the world’s most interactive data visualization software that will support all your data presentation needs with incredible speed.
What is ZoomCharts?
What defines ZoomCharts advanced data visualization software? It is NOT another HTML5 charts library. It is:
- Interactive
- Fast
- Touch enabled
- Supports big data
A long time ago
DOS 6.2 allowed for:
- 320x240x8bpp
- Direct access to pixels on screen
- Assembler for performance
Today, the Web has finally caught up in the graphics department. Now, we have access to:
- Multiple browsers and rendering technologies
- Multiple resolutions
- Performance that varies by browser and device
Development setup:
- We write in JavaScript
- Commit to GitHub
- Build system in JavaScript
- Debug in Chrome
- Run automated tests
- Like WebStorm (and Vim)
Graphics:
Canvas (fast)
SVG (slow)
WebGL (>50%)
Interactive animations:
Zoom in and out of the graph, drag and drop data, all with your mouse or trackpad.
Graceful degradation:
High FPS (frames per second) lets you scale graphics with low image degradation.
Third party libraries:
- Raphael
- Hammer.js
- Leaflet
- Moment.js
Challenges:
- Responsive design: layouts can shift and look nice on desktop screens vs. not so nice on vertical, mobile screens
- Big screen resolutions: uses devicePixelRatio for sharp rendering, but no hardware acceleration beyond 2048x2048
- Safari compatibility: with 100% CPU, input events are blocked and browser locks up; strange code offers fixes
- HTML on canvas: DOM is slow; basic HTML markup must be parsed and rendered manually; text caching helps
Support:
- Process: TrialSupportBuy
- 1 day issue resolution
- #1 Tell me what I did wrong
- #2 Can you do…
Testing:
- Automated tests on every GIT push
Automatically:
- Compare images
- Record performance
- View errors in console
Interactive testing:
- Next step: record and playback
BrowserStack:
- Interactive mode
- Automated: Selenium API
Debugging:
Chrome Developer tools (F12)
- Debugging
- Profiling
- Timeline
Remote debugging available: developer.chrome.com/devtools/docs/remote-debugging
Future:
- More charts
- Extension API
- Memory allocation tracking
- WebGL
We are looking for statically-typed language:
- Error checking
- Performance
- Superior minification
- Easy to write and read
- Easy to call from JS
Building
Custom build script:
- Compile
- Minify
- Extract documentation
- Embed customer data
Check out ZoomCharts products:
Network Chart
Big network exploration
Explore linked data sets. Highlight relevant data with dynamic filters and visual styles. Incremental data loading. Exploration with focus nodes.
Time Chart
Time navigation and exploration tool
Browse activity logs, select time ranges. Multiple data series and value axes. Switch between time units.
Pie Chart
Amazingly intuitive hierarchical data exploration
Get quick overview of your data and drill down when necessary. All in a single easy to use chart.
Facet Chart
Scrollable bar chart with drill-down
Compare values side by side and provide easy access to the long tail.
ZoomCharts
The world’s most interactive data visualization software
#zoomcharts #interactive #data #interactivedata #datavisualization #interactivedatavisualization #chart #graph #charts #graphs #Javascript #JavascriptSDK #DevClubIV #Latvia #PowerPoint #PowerPointpresentation #fast #bigdata
London JS: Data Visualisation at Poke London
3D Cities and Data Visualisation with WebGL presented by Robin Hawkes
Using D3.js to visualise your analytics data presented by Edd Sowden
10 things you didn't know about D3.js presented by Anna Powell-Smith
Lanyrd: lanyrd.com/2013/londonjs-25/
OpenGL ES 10th anniversary party at SIGGRAPH 2013 with the Khronos Group.
Photo copyright by NorekeFoto used with permission from NorekeFoto
Inspired by SimCity’s data overlays, Rob Hawkes and Pete Smart set out to try and create that for real-world cities. Their experiment has evolved into ViziCities, which they demo’d here at Front Trends 2013. In the shot, you see Rob controlling their WebGL-powered visualization by way of a LeapMotion controller. Future, I love you.
ZoomCharts at DevClub.lv: Developing a Javascript SDK
On January 15, 2015, ZoomCharts Co-Founder and CTO Viesturs Zariņš presented at DevClub.lv - a community of Latvian IT specialists that gather monthly and host free talks, presentations, and events to allow the local IT community to share knowledge, network, and communicate. Zariņš discussed the unique challenges faced in developing JavaScript SDK.
Here is a brief overview of his PowerPoint presentation on ZoomCharts, the world’s most interactive data visualization software that will support all your data presentation needs with incredible speed.
What is ZoomCharts?
What defines ZoomCharts advanced data visualization software? It is NOT another HTML5 charts library. It is:
- Interactive
- Fast
- Touch enabled
- Supports big data
A long time ago
DOS 6.2 allowed for:
- 320x240x8bpp
- Direct access to pixels on screen
- Assembler for performance
Today, the Web has finally caught up in the graphics department. Now, we have access to:
- Multiple browsers and rendering technologies
- Multiple resolutions
- Performance that varies by browser and device
Development setup:
- We write in JavaScript
- Commit to GitHub
- Build system in JavaScript
- Debug in Chrome
- Run automated tests
- Like WebStorm (and Vim)
Graphics:
Canvas (fast)
SVG (slow)
WebGL (>50%)
Interactive animations:
Zoom in and out of the graph, drag and drop data, all with your mouse or trackpad.
Graceful degradation:
High FPS (frames per second) lets you scale graphics with low image degradation.
Third party libraries:
- Raphael
- Hammer.js
- Leaflet
- Moment.js
Challenges:
- Responsive design: layouts can shift and look nice on desktop screens vs. not so nice on vertical, mobile screens
- Big screen resolutions: uses devicePixelRatio for sharp rendering, but no hardware acceleration beyond 2048x2048
- Safari compatibility: with 100% CPU, input events are blocked and browser locks up; strange code offers fixes
- HTML on canvas: DOM is slow; basic HTML markup must be parsed and rendered manually; text caching helps
Support:
- Process: TrialSupportBuy
- 1 day issue resolution
- #1 Tell me what I did wrong
- #2 Can you do…
Testing:
- Automated tests on every GIT push
Automatically:
- Compare images
- Record performance
- View errors in console
Interactive testing:
- Next step: record and playback
BrowserStack:
- Interactive mode
- Automated: Selenium API
Debugging:
Chrome Developer tools (F12)
- Debugging
- Profiling
- Timeline
Remote debugging available: developer.chrome.com/devtools/docs/remote-debugging
Future:
- More charts
- Extension API
- Memory allocation tracking
- WebGL
We are looking for statically-typed language:
- Error checking
- Performance
- Superior minification
- Easy to write and read
- Easy to call from JS
Building
Custom build script:
- Compile
- Minify
- Extract documentation
- Embed customer data
Check out ZoomCharts products:
Network Chart
Big network exploration
Explore linked data sets. Highlight relevant data with dynamic filters and visual styles. Incremental data loading. Exploration with focus nodes.
Time Chart
Time navigation and exploration tool
Browse activity logs, select time ranges. Multiple data series and value axes. Switch between time units.
Pie Chart
Amazingly intuitive hierarchical data exploration
Get quick overview of your data and drill down when necessary. All in a single easy to use chart.
Facet Chart
Scrollable bar chart with drill-down
Compare values side by side and provide easy access to the long tail.
ZoomCharts
The world’s most interactive data visualization software
#zoomcharts #interactive #data #interactivedata #datavisualization #interactivedatavisualization #chart #graph #charts #graphs #Javascript #JavascriptSDK #DevClubIV #Latvia #PowerPoint #PowerPointpresentation #fast #bigdata
OpenGL ES 10th anniversary party at SIGGRAPH 2013 with the Khronos Group.
Photo copyright by NorekeFoto used with permission from NorekeFoto
Ideum was tasked with creating a Command Center of the Future. We drew inspiration from cinematic, sci-fi sequences found in films such as Minority Report and Oblivion. None of the sequences created in this application employ special effects. This is a real-time application that draws on real data for its simulations. Learn more about our custom software applications as www.ideum.com
来自 dl.dropbox.com/u/39519/talks/tooling-q1/index.html
ln.hixie.ch/?start=1037910467&count=1
ln.hixie.ch/?start=1137740632&count=1
software.hixie.ch/utilities/js/live-dom-viewer/
sassymothereffingtextshadow.com/
clausreinke.github.com/js-tools/resources.html
Boilerplate:
github.com/csnover/dojo-boilerplate
Authoring Abstractions:
code.google.com/p/closure-stylesheets/
daringfireball.net/projects/markdown/
github.com/jashkenas/coffee-script/wiki/List-of-languages...
Frameworks, Clientside Stack, Application Architecture:
rmurphey.com/blog/2010/08/11/on-rolling-your-own/
addyosmani.com/resources/toolschart/chart.pdf
zetafleet.com/i/4d75a4efc33d4.png
addyosmani.com/toolsforjqueryapparchitecture/
Iteration Workflow
Iteration Automators:
compass watch
addyosmani.com/blog/autosave-changes-chrome-dev-tools/
Editors and IDEs:
net.tutsplus.com/tutorials/tools-and-tips/sublime-text-2-...
net.tutsplus.com/tutorials/tools-and-tips/essential-textm...
www.jetbrains.com/webstorm/features/
Browser Dev Tools:
code.google.com/chrome/devtools/
benvanik.github.com/WebGL-Inspector/
code.google.com/chrome/mobile/docs/debugging.html
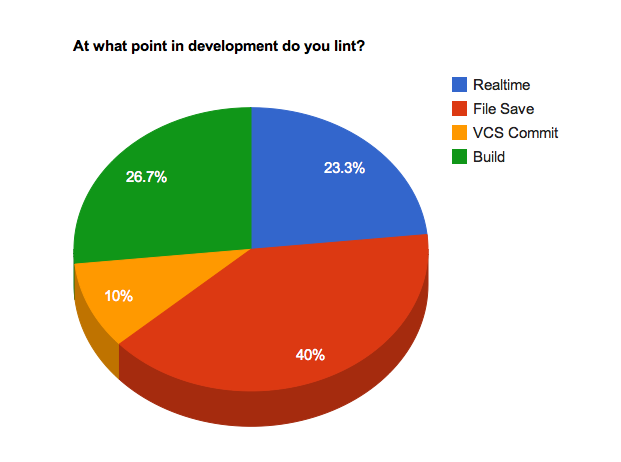
Linting:
code.google.com/closure/utilities/
code.google.com/p/closure-stylesheets/
Testing:
code.google.com/p/js-test-driver/
plus.google.com/113127438179392830442/posts/Z1LpEhfKTqo
code.google.com/chrome/devtools/docs/cpu-profiling.html
gent.ilcore.com/2011/08/finding-memory-leaks.html
code.google.com/chrome/devtools/docs/heap-profiling.html
Build + Optimization:
code.google.com/closure/compiler/
developer.yahoo.com/yui/compressor/
code.google.com/p/htmlcompressor/
Automating the automators:
html5boilerplate.com/docs/Build-script/
github.com/balupton/buildr.npm
Deployment: