
rmforall@gmail.com
#19. astroMSgalseq_D_063
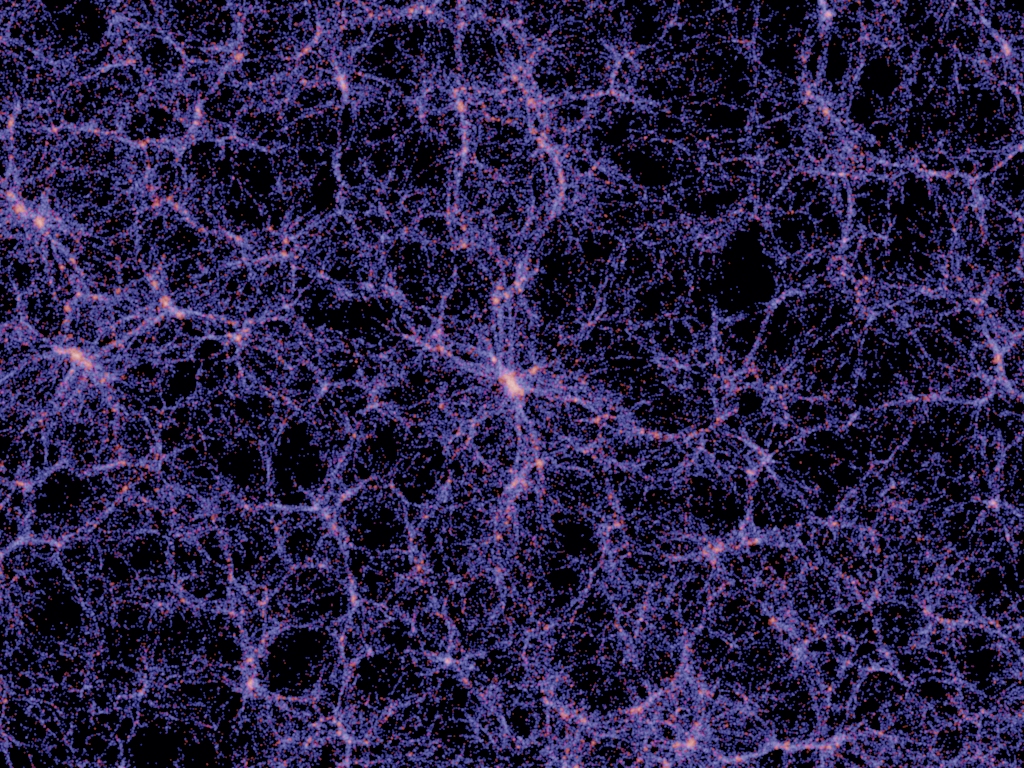
#19. The Millennium Simulation, announced 2005.06.02 by the Virgo consortium, used the largest supercomputer in Europe, at the German Astrophysical Virtual Observatory, for over a month to model the history of the Universe in a cube over 2 billion light years on a side, holding 20 million galaxies.
static.flickr.com/13/18135102_07a58fd89d_o.jpg
This image is a closeup of the results at redshift z = 0, showing a 15 MPC/h thick slice, showing the visible light distribution, which closely follows the mass distribution. The view is four times wider than in #18, so that the width of the image is 1628 MLy. The length of the central large and dense galaxy cluster is about 60 MLy.
1024 X 768 pixels jpg 0.970950 MB
The distance measure Mpc/h has been used for decades to adjust to the fact that the Hubble constant = H has not been exactly determined. Mpc is megaparsecs.
A parsec is 3.26 light years. The Millennium Simulation used the value 0.73 for the Hubble constant H.
To get the distance in Mpc, we multiply their value by 100/H = 100/0.73 = 1.37 .
The huge, densely packed galaxy cluster, holding thousands of galaxies, for the greenish central region, has a length of about 60 MLy. In contrast, the nearest large neighbor to our Milky Way galaxy is Andromeda galaxy at 2.2 MLy distance.
The distribution of mass in the Universe is very fractile -- it looks just as complex and very much the same at a very wide range of distance scales.
So, even though I do not know how wide this image would be in terms of angular measures (degrees, minutes, seconds), it is probably justified to compare it to the Capodimonte Deep Field subtle background visible light images.
Many features are the same: complex 3D fractile network, with bright boundaries around both brighter (more dense) and dimmer (more empty) regions, and both brighter and thicker and thinner and dimmer lines, marked by myriad tiny dense features. I don't believe that the MS image includes gravitational lensing, which must be a complex factor in the CDF images.
Click on All Sizes to view Original.
www.pparc.ac.uk/Nw/millennium_sim.asp The Virgo consortium
www.mpa-garching.mpg.de/galform/millennium/
www.mpa-garching.mpg.de/galform/millennium/galseq_D_063.jpg
arxiv.org/abs/astro-ph/0504097
Simulating the joint evolution of quasars, galaxies and their large-scale distribution
pil.phys.uniroma1.it/debate3.html
On the fractile structure of the universe
Sylos Labini, Montuori & Pietronero
#19. astroMSgalseq_D_063
#19. The Millennium Simulation, announced 2005.06.02 by the Virgo consortium, used the largest supercomputer in Europe, at the German Astrophysical Virtual Observatory, for over a month to model the history of the Universe in a cube over 2 billion light years on a side, holding 20 million galaxies.
static.flickr.com/13/18135102_07a58fd89d_o.jpg
This image is a closeup of the results at redshift z = 0, showing a 15 MPC/h thick slice, showing the visible light distribution, which closely follows the mass distribution. The view is four times wider than in #18, so that the width of the image is 1628 MLy. The length of the central large and dense galaxy cluster is about 60 MLy.
1024 X 768 pixels jpg 0.970950 MB
The distance measure Mpc/h has been used for decades to adjust to the fact that the Hubble constant = H has not been exactly determined. Mpc is megaparsecs.
A parsec is 3.26 light years. The Millennium Simulation used the value 0.73 for the Hubble constant H.
To get the distance in Mpc, we multiply their value by 100/H = 100/0.73 = 1.37 .
The huge, densely packed galaxy cluster, holding thousands of galaxies, for the greenish central region, has a length of about 60 MLy. In contrast, the nearest large neighbor to our Milky Way galaxy is Andromeda galaxy at 2.2 MLy distance.
The distribution of mass in the Universe is very fractile -- it looks just as complex and very much the same at a very wide range of distance scales.
So, even though I do not know how wide this image would be in terms of angular measures (degrees, minutes, seconds), it is probably justified to compare it to the Capodimonte Deep Field subtle background visible light images.
Many features are the same: complex 3D fractile network, with bright boundaries around both brighter (more dense) and dimmer (more empty) regions, and both brighter and thicker and thinner and dimmer lines, marked by myriad tiny dense features. I don't believe that the MS image includes gravitational lensing, which must be a complex factor in the CDF images.
Click on All Sizes to view Original.
www.pparc.ac.uk/Nw/millennium_sim.asp The Virgo consortium
www.mpa-garching.mpg.de/galform/millennium/
www.mpa-garching.mpg.de/galform/millennium/galseq_D_063.jpg
arxiv.org/abs/astro-ph/0504097
Simulating the joint evolution of quasars, galaxies and their large-scale distribution
pil.phys.uniroma1.it/debate3.html
On the fractile structure of the universe
Sylos Labini, Montuori & Pietronero