
rmforall@gmail.com
#18. astroMSseqF_063aL
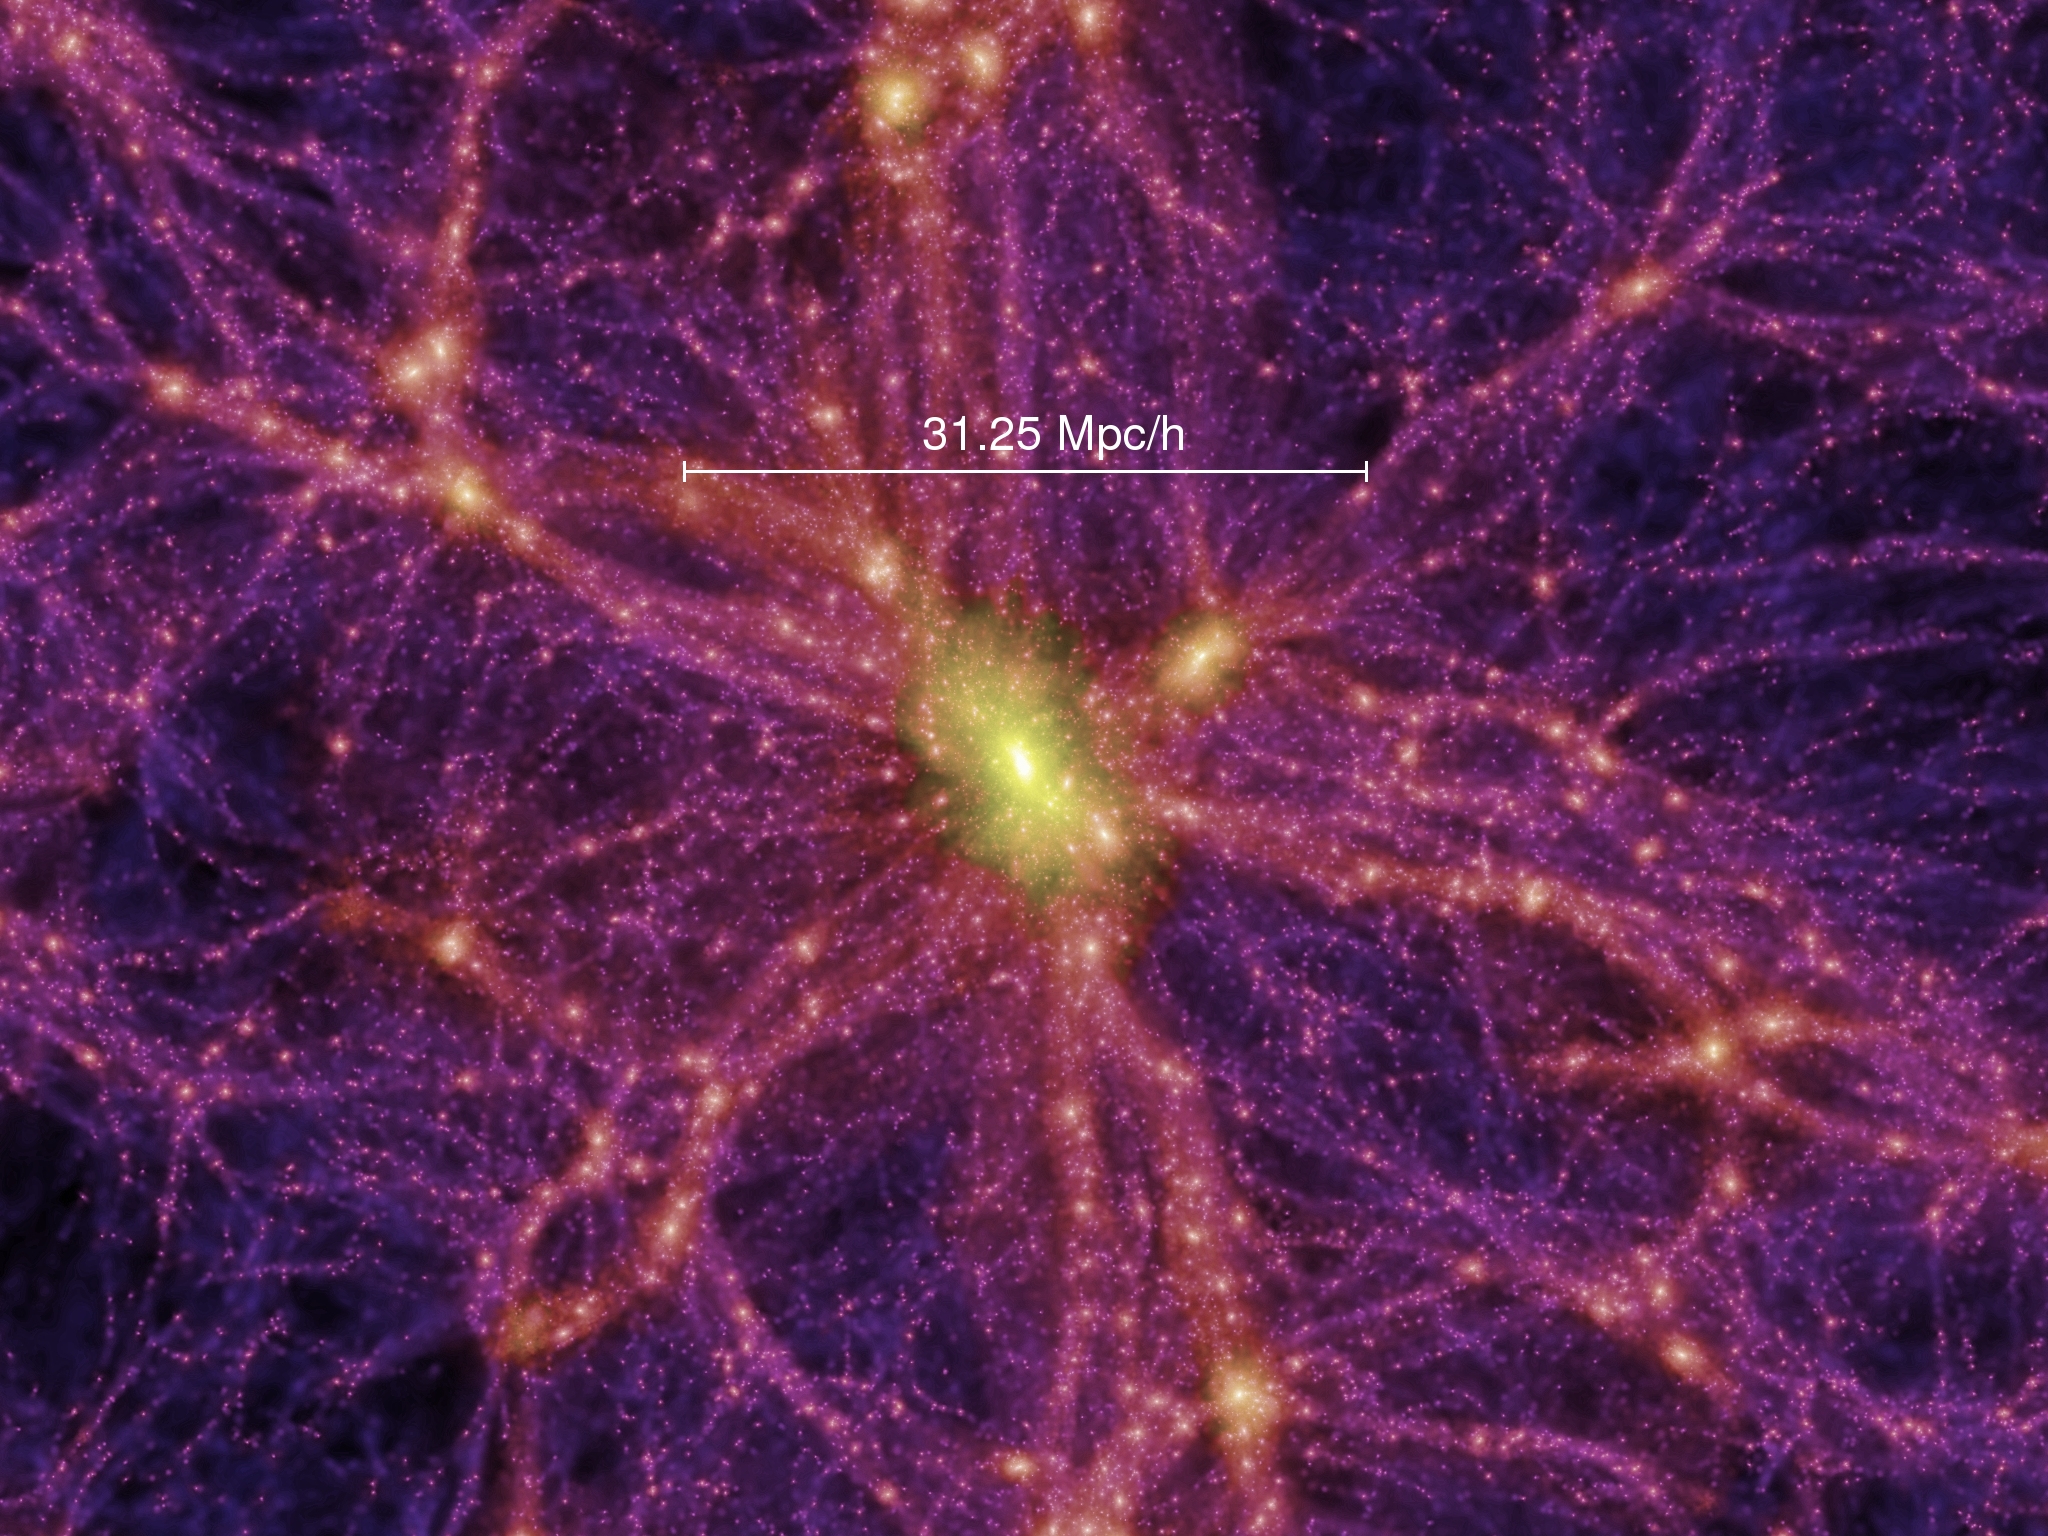
#18. The Millennium Simulation, announced 2005.06.02 by the Virgo consortium, used the largest supercomputer in Europe, at the German Astrophysical Virtual Observatory, for over a month to model the history of the Universe in a cube over 2 billion light years on a side, holding 20 million galaxies.
static.flickr.com/12/18135101_1ef7723b85_o.jpg
This image is a closeup of the results at redshift z = 0, showing a 15 MPC/h thick slice, showing the mass distribution, not the visible light.
2048 X 1536 pixels jpg 2.07411 MB
You can magnify this image 8X to see pixels of 1 mm size on a 17" monitor.
The distance measure Mpc/h has been used for decades to adjust to the fact that the Hubble constant = H has not been exactly determined. Mpc is megaparsecs.
A parsec is 3.26 light years. The Millennium Simulation used the value 0.73 for the Hubble constant H.
To get the distance in Mpc, we multiply their value by 100/H = 100/0.73 = 1.37 , which for the scale bar of 31.25 Mpc/h becomes 42.8 Mpc = 139.6 MLy.
This image has a width, directly measured on my monitor, of 91.1 Mpc/h =
124.8 Mpc = 406.9 MLy.
The huge, densely packed galaxy cluster, holding thousands of galaxies, for the greenish central region, has a length of about 2/13.6 = 14.7 % of the image width = 60 MLy. In contrast, the nearest large neighbor to our Milky Way galaxy is Andromeda galaxy at 2.2 MLy distance.
The distribution of mass in the Universe is very fractile -- it looks just as complex and very much the same at a very wide range of distance scales.
So, even though I do not know how wide this image would be in terms of angular measures (degrees, minutes, seconds), it is probably justified to compare it to the Capodimonte Deep Field subtle background visible light images.
Many features are the same: complex 3D fractile network, with bright boundaries around both brighter (more dense) and dimmer (more empty) regions, and both brighter and thicker and thinner and dimmer lines, marked by myriad tiny dense features. I don't believe that the MS image includes gravitational lensing, which must be a complex factor in the CDF images.
Click on All Sizes to view Large and Original.
www.pparc.ac.uk/Nw/millennium_sim.asp The Virgo consortium
www.mpa-garching.mpg.de/galform/millennium/
www.mpa-garching.mpg.de/galform/millennium/seqF_063a.jpg
arxiv.org/abs/astro-ph/0504097
Simulating the joint evolution of quasars, galaxies and their large-scale distribution
pil.phys.uniroma1.it/debate3.html
On the fractile structure of the universe
Sylos Labini, Montuori & Pietronero
www.space.com/scienceastronomy/first_star_011115.html popular article by Robert Roy Britt 2001.11.15 on www.space.com re Tom Abel simulation of the first start in our Universe www.tomabel.com/
www.solstation.com/x-objects/first.htm excellent general introduction to many recent simulations of the first stars -- many links
www.astro.psu.edu/users/tabel/GB/gb.html many awesome images and movies of simulations of the first structures and stars in our Universe by Tom Abel, Greg Bryan, and Mike Norman in 2001
www.astro.psu.edu/users/tabel/GB/gb.html frame by frame tour of the simulation with commentary
www.mpia-hd.mpg.de/GALAXIES/CADIS/irsee2003/PROCEEDINGS/A...
the first stars, a slideshow review by Tom Abel
Compare #21 Closeup of many tiny bright sources on background mesh in HUDF.
#18. astroMSseqF_063aL
#18. The Millennium Simulation, announced 2005.06.02 by the Virgo consortium, used the largest supercomputer in Europe, at the German Astrophysical Virtual Observatory, for over a month to model the history of the Universe in a cube over 2 billion light years on a side, holding 20 million galaxies.
static.flickr.com/12/18135101_1ef7723b85_o.jpg
This image is a closeup of the results at redshift z = 0, showing a 15 MPC/h thick slice, showing the mass distribution, not the visible light.
2048 X 1536 pixels jpg 2.07411 MB
You can magnify this image 8X to see pixels of 1 mm size on a 17" monitor.
The distance measure Mpc/h has been used for decades to adjust to the fact that the Hubble constant = H has not been exactly determined. Mpc is megaparsecs.
A parsec is 3.26 light years. The Millennium Simulation used the value 0.73 for the Hubble constant H.
To get the distance in Mpc, we multiply their value by 100/H = 100/0.73 = 1.37 , which for the scale bar of 31.25 Mpc/h becomes 42.8 Mpc = 139.6 MLy.
This image has a width, directly measured on my monitor, of 91.1 Mpc/h =
124.8 Mpc = 406.9 MLy.
The huge, densely packed galaxy cluster, holding thousands of galaxies, for the greenish central region, has a length of about 2/13.6 = 14.7 % of the image width = 60 MLy. In contrast, the nearest large neighbor to our Milky Way galaxy is Andromeda galaxy at 2.2 MLy distance.
The distribution of mass in the Universe is very fractile -- it looks just as complex and very much the same at a very wide range of distance scales.
So, even though I do not know how wide this image would be in terms of angular measures (degrees, minutes, seconds), it is probably justified to compare it to the Capodimonte Deep Field subtle background visible light images.
Many features are the same: complex 3D fractile network, with bright boundaries around both brighter (more dense) and dimmer (more empty) regions, and both brighter and thicker and thinner and dimmer lines, marked by myriad tiny dense features. I don't believe that the MS image includes gravitational lensing, which must be a complex factor in the CDF images.
Click on All Sizes to view Large and Original.
www.pparc.ac.uk/Nw/millennium_sim.asp The Virgo consortium
www.mpa-garching.mpg.de/galform/millennium/
www.mpa-garching.mpg.de/galform/millennium/seqF_063a.jpg
arxiv.org/abs/astro-ph/0504097
Simulating the joint evolution of quasars, galaxies and their large-scale distribution
pil.phys.uniroma1.it/debate3.html
On the fractile structure of the universe
Sylos Labini, Montuori & Pietronero
www.space.com/scienceastronomy/first_star_011115.html popular article by Robert Roy Britt 2001.11.15 on www.space.com re Tom Abel simulation of the first start in our Universe www.tomabel.com/
www.solstation.com/x-objects/first.htm excellent general introduction to many recent simulations of the first stars -- many links
www.astro.psu.edu/users/tabel/GB/gb.html many awesome images and movies of simulations of the first structures and stars in our Universe by Tom Abel, Greg Bryan, and Mike Norman in 2001
www.astro.psu.edu/users/tabel/GB/gb.html frame by frame tour of the simulation with commentary
www.mpia-hd.mpg.de/GALAXIES/CADIS/irsee2003/PROCEEDINGS/A...
the first stars, a slideshow review by Tom Abel
Compare #21 Closeup of many tiny bright sources on background mesh in HUDF.